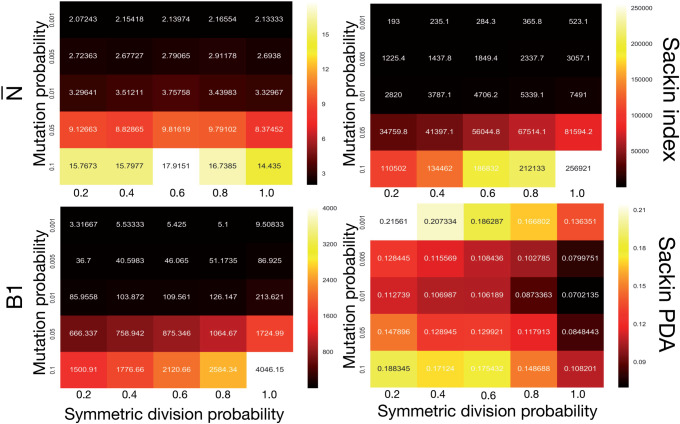
Figure 7.
Comparing phylogenetic tree measures across symmetric division probability and mutation probability. We plot the average of each of four phylogenetic tree measures at the end of each of  simulations for a range of symmetric division probabilities and mutation probabilities. We vary mutational probability over two orders of magnitude (
 ), and simulate all tested symmetric division probabilities. Rank is maintained across symmetric division probabilities for each of the three of the four measures with which we could discriminate between symmetric division probabilities with changing mutation probability, allowing for differentiation between parameters. As before, the
  statistic is not predictive. As expected, for the nonnormalized indices, Sackin, and B1, the measures change monotonically with both symmetric division and mutation probability. For the PDA normalized Sackin index, however, there is a global minimum for
  and
and  .
.

