
Figure 1.
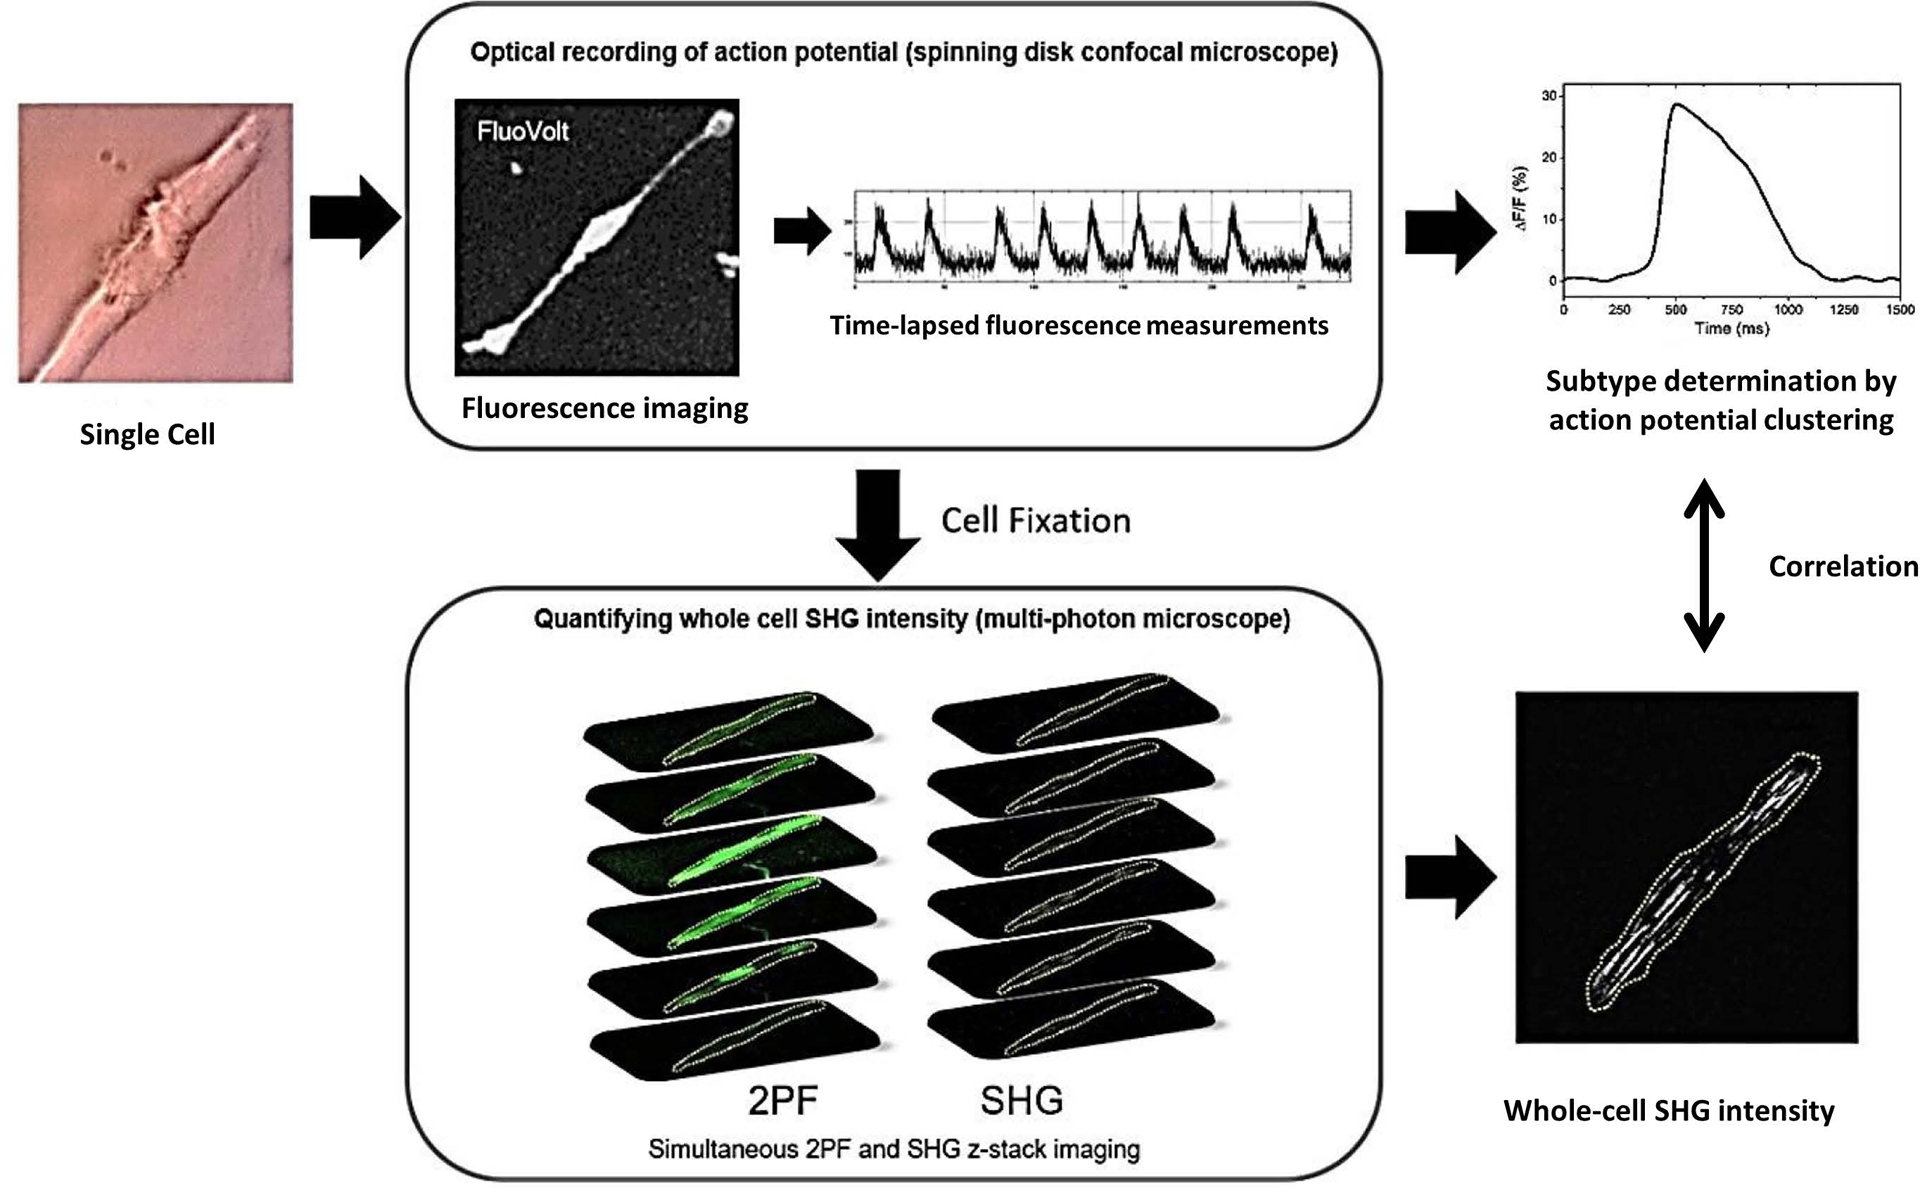
Diagram illustrating the method of identifying the subtype of individual hiPSC-derived cardiomyocytes and correlating it to their whole cell SHG intensity. Single cells (40 days in culture) were re-plated onto gridded glass dishes for 55–67 days for a total of 95–107 days post-differentiation (noted D95 in the manuscript). Cells were loaded with the voltage-sensitive dye FluoVolt. The spontaneous action potentials of individual cells were recorded with a spinning disk fluorescence microscope to measure the time-lapsed fluorescence intensity at ~100 frames per second for ~1 minute. The subtype was determined by the clustering analysis of the action potential (AP) profiles. Cells were then fixed and whole-cell SHG measurements were performed on a multi-photon microscope using a circularly polarized excitation beam. The whole-cell SHG intensity was obtained by performing z-stack imaging and summing the SHG signal intensity from all z-planes. The two-photon fluorescence (2PF) signal from the cell membrane was used as a guide to outline the cell boundary.