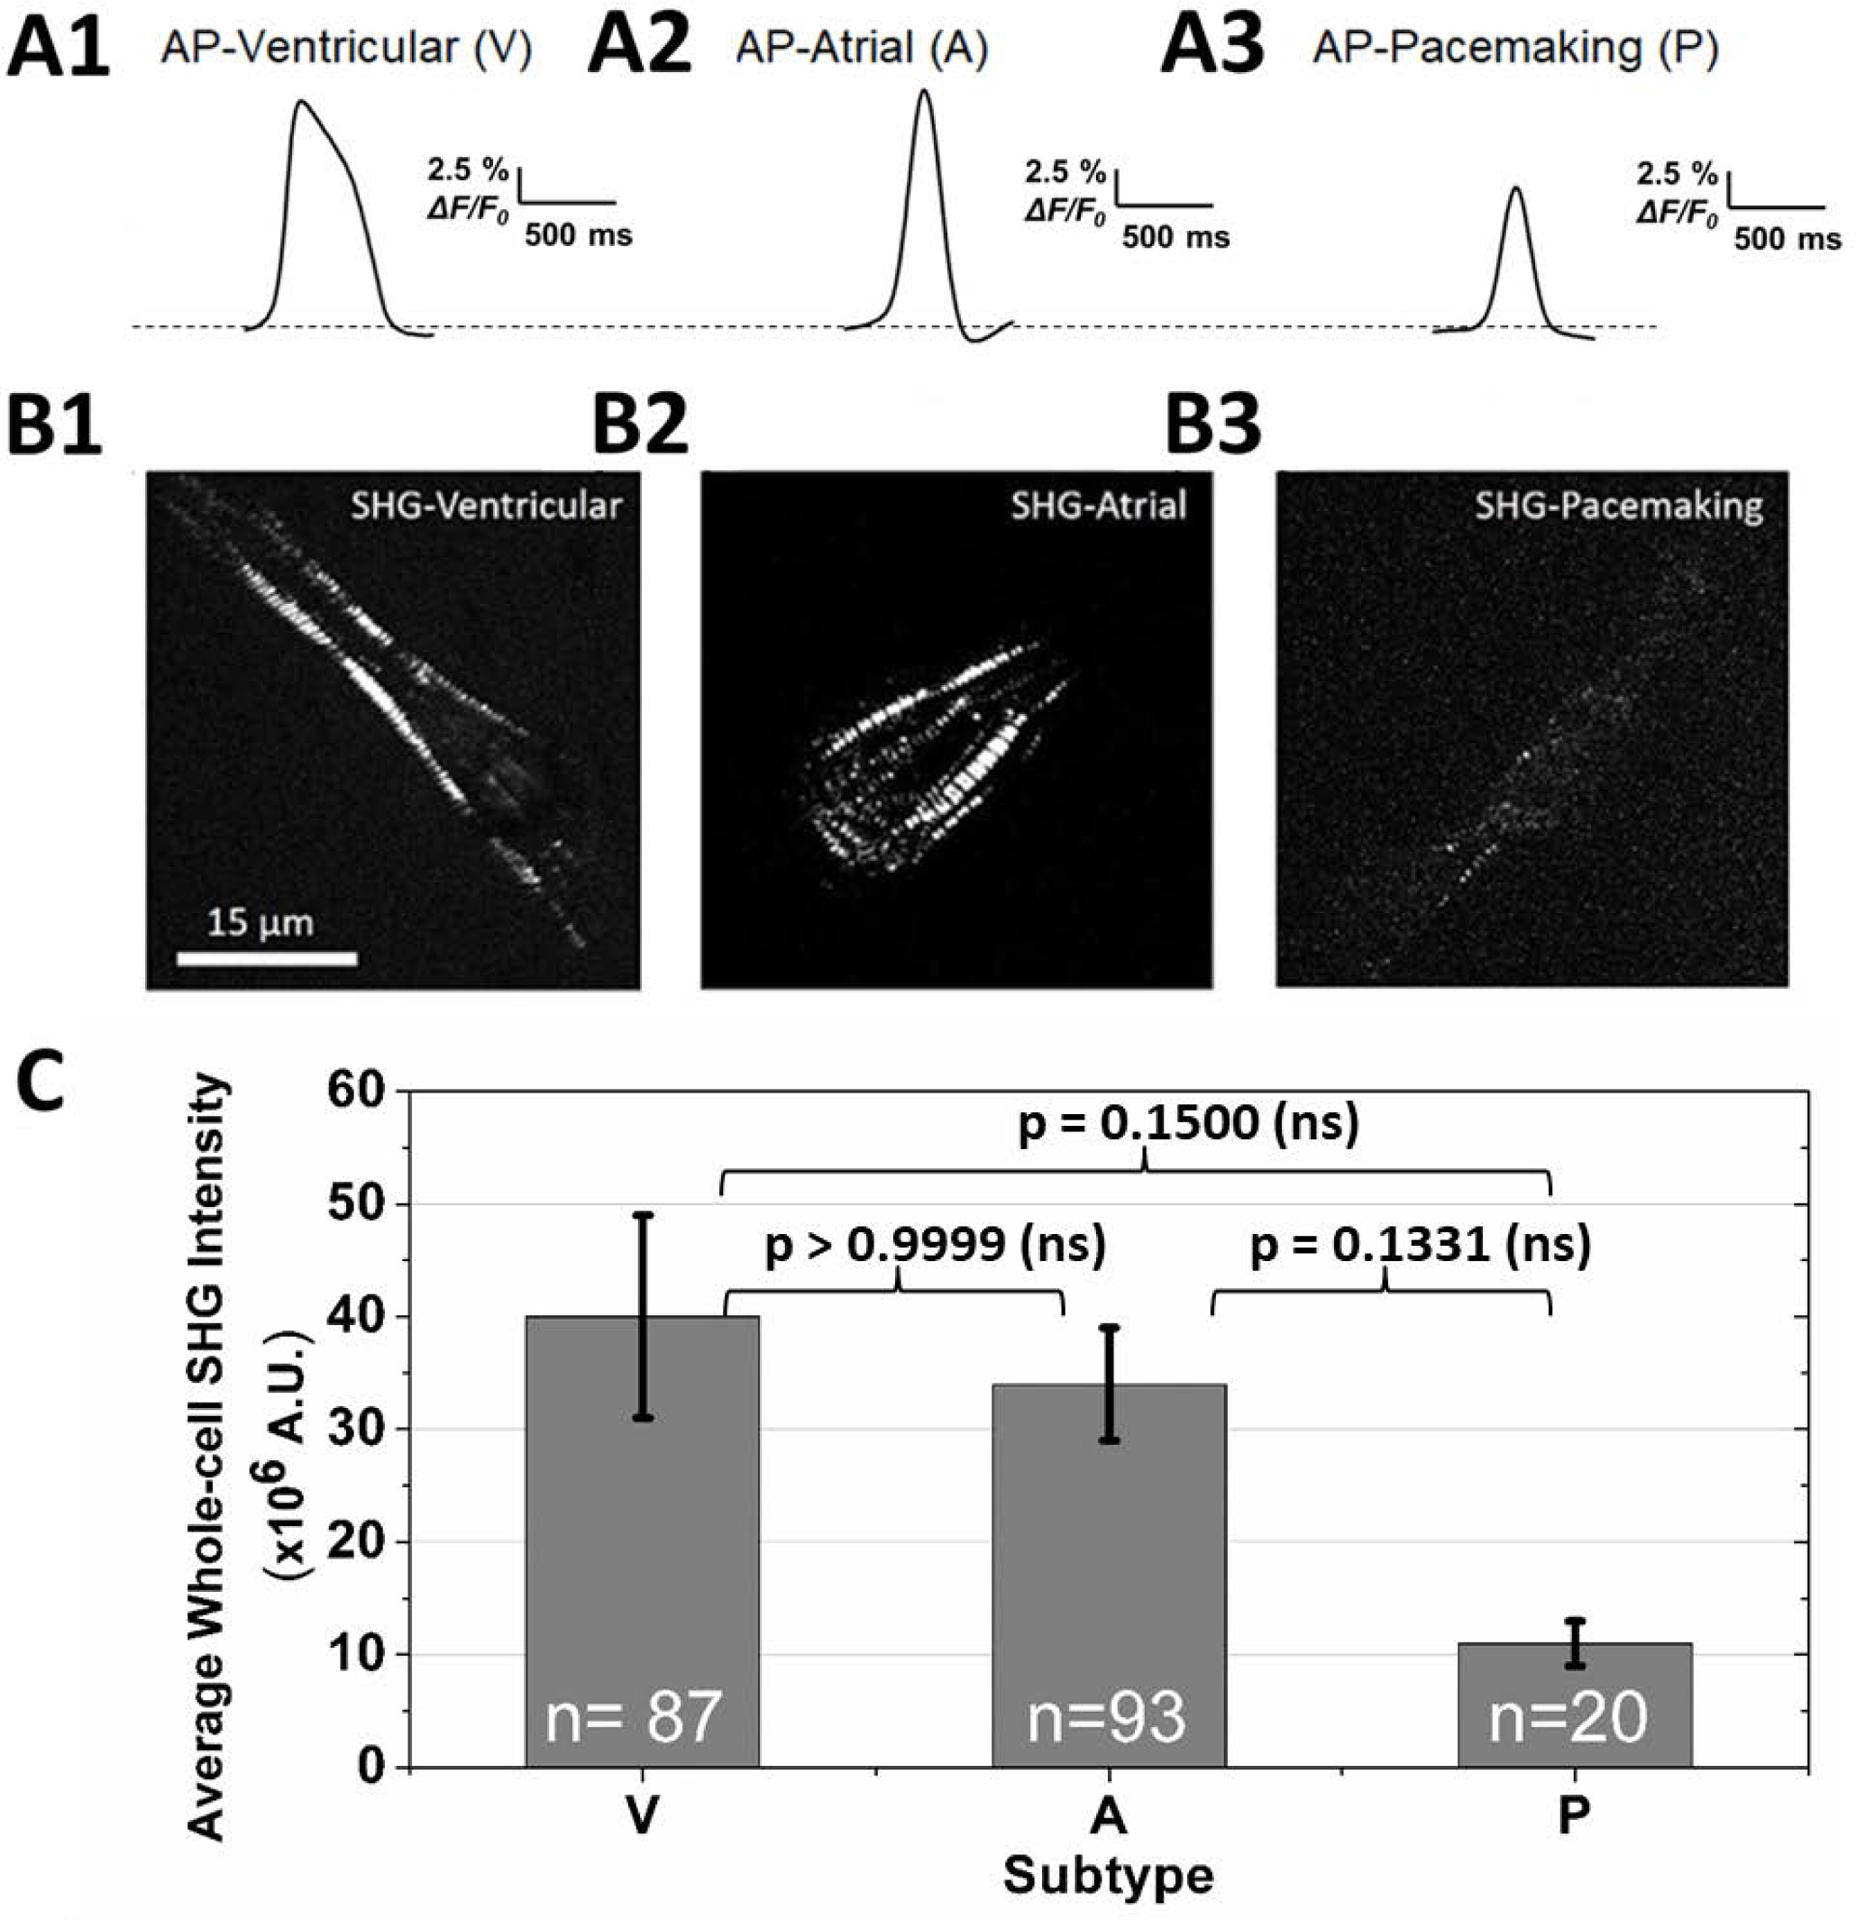
Figure 2.

(A) Representative action potential profiles used to classify the cardiomyocyte subtype of each cell (V: ventricular-like; A: atrial-like, P: pacemaking-like hiPSC-CMs). (B) Representative whole-cell SHG images show that the contractile cells exhibit more organized sarcomeric striation patterns, while pacemaker-like cells typically have a lower SHG signal intensity from less organized sarcomeric structures. (C) Average whole-cell SHG intensities for each cardiac subtype. The SHG signal strength of pacemaker-like cells is ~70% less than the contractile cells. The average whole-cell SHG intensity ± standard error for ventricular-like, atrial-like, and pacemaking-like cells are 40±9, 34±5, and 11±2 million A.U., respectively. A Kruskal-Wallis test was used to assess the significance of the difference in SHG intensities between subtypes. P-values were greater than 0.05, indicating the differences were non-significant (ns). The distribution of SHG intensity for all cells of each subtype is shown in the histograms in Figure 3.
