Figure 3.

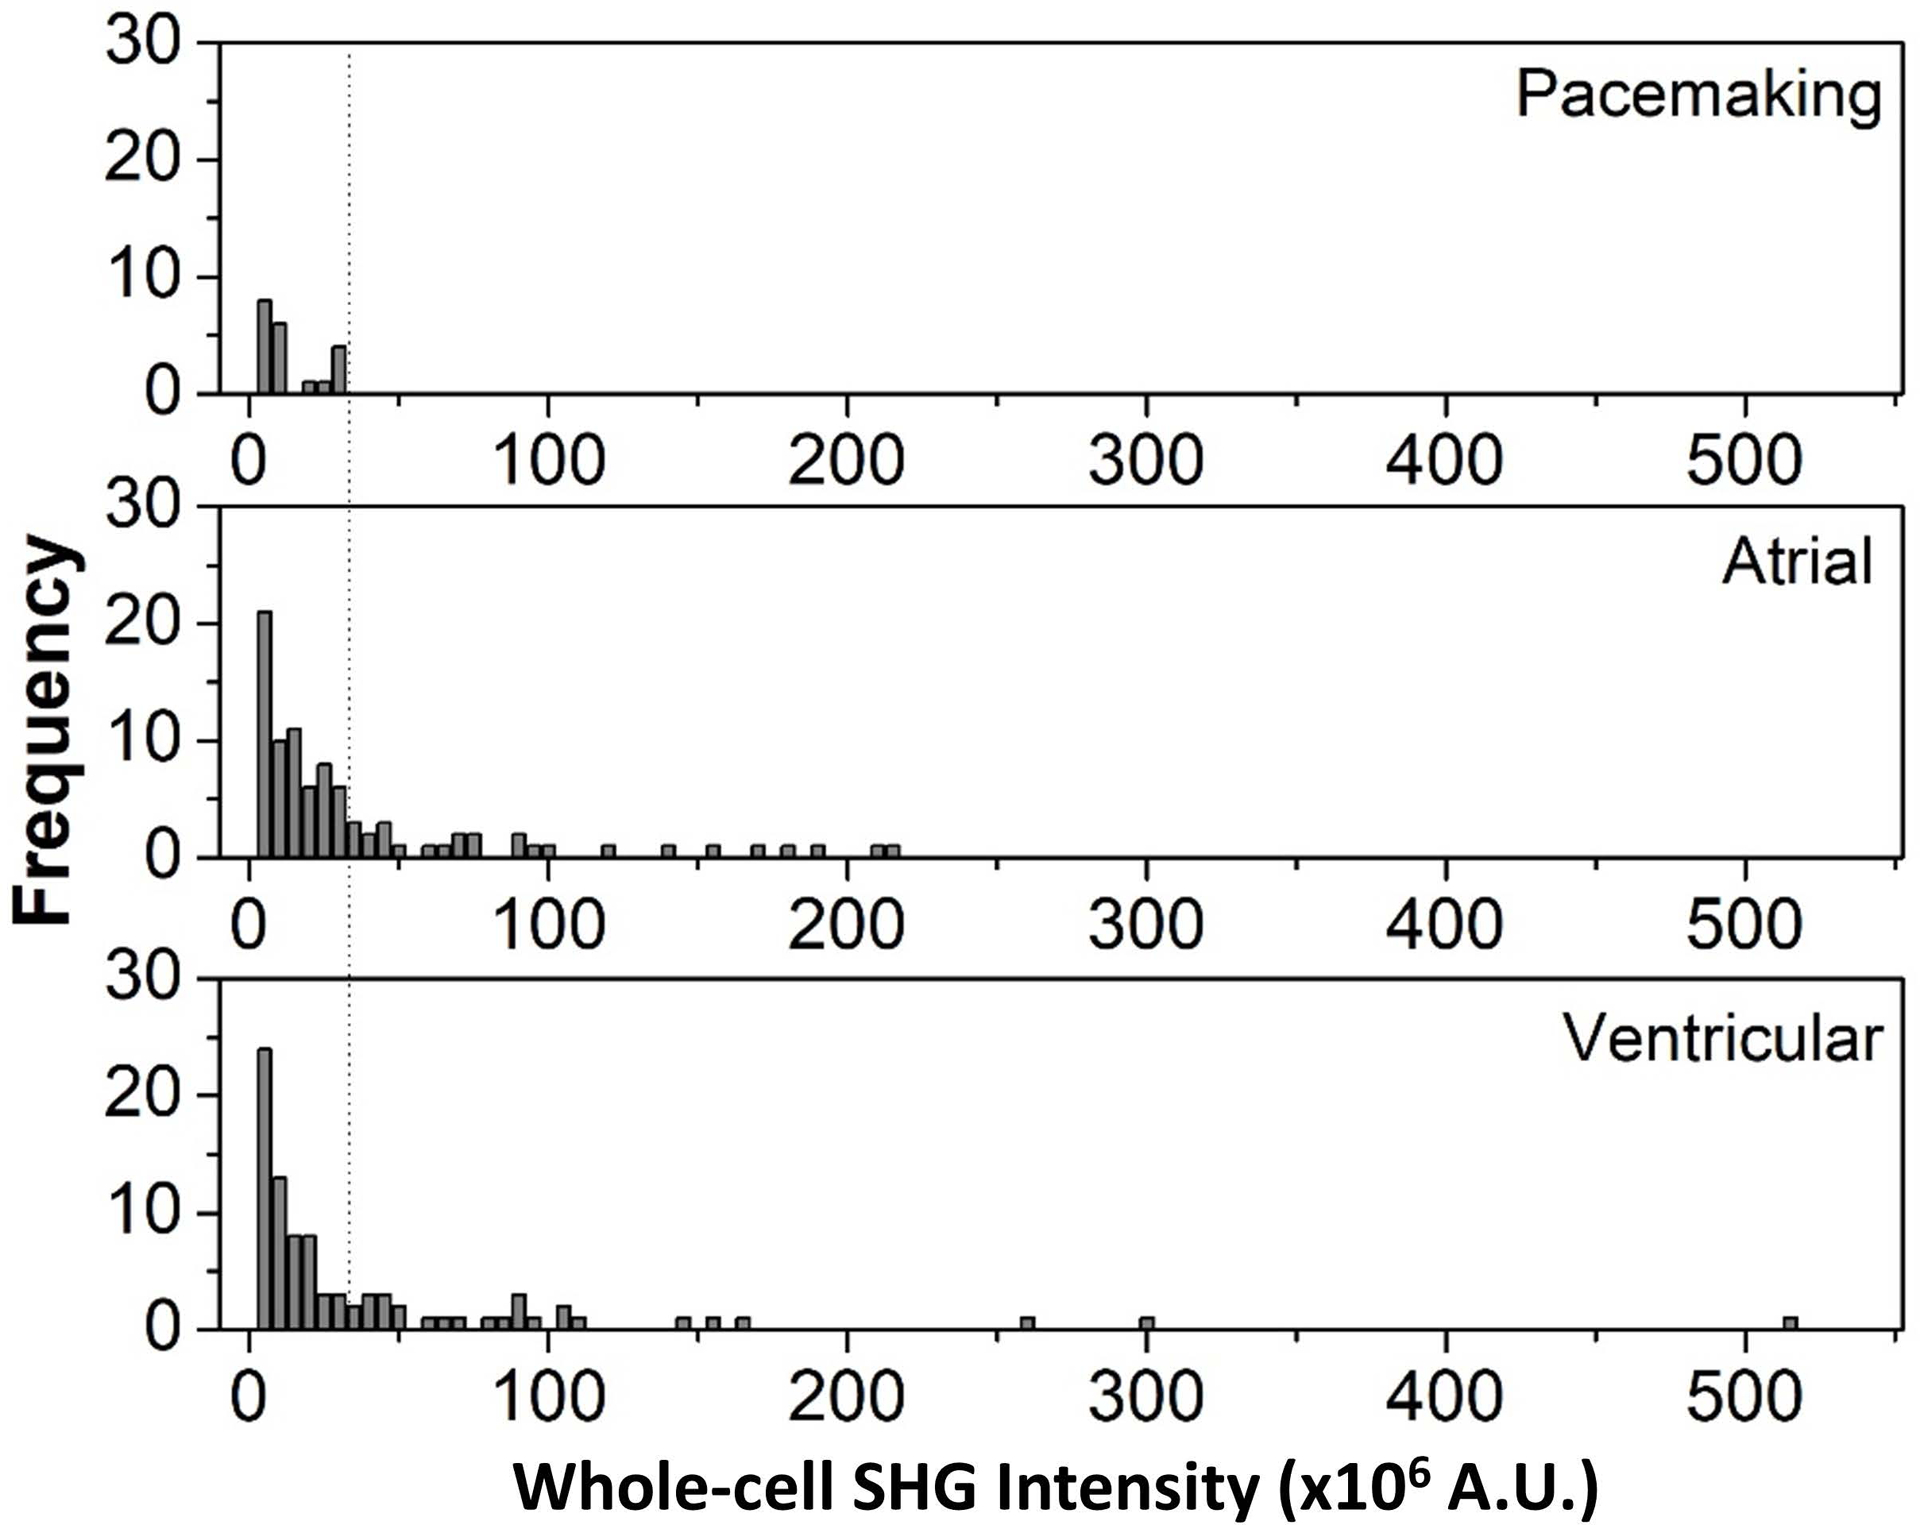
Histogram plots of whole-cell SHG intensity for each cardiomyocyte subtype. The dashed line indicates an SHG signal threshold of 30×106 counts that can be used to separate pacemaker-like cells from the other cells.

Histogram plots of whole-cell SHG intensity for each cardiomyocyte subtype. The dashed line indicates an SHG signal threshold of 30×106 counts that can be used to separate pacemaker-like cells from the other cells.