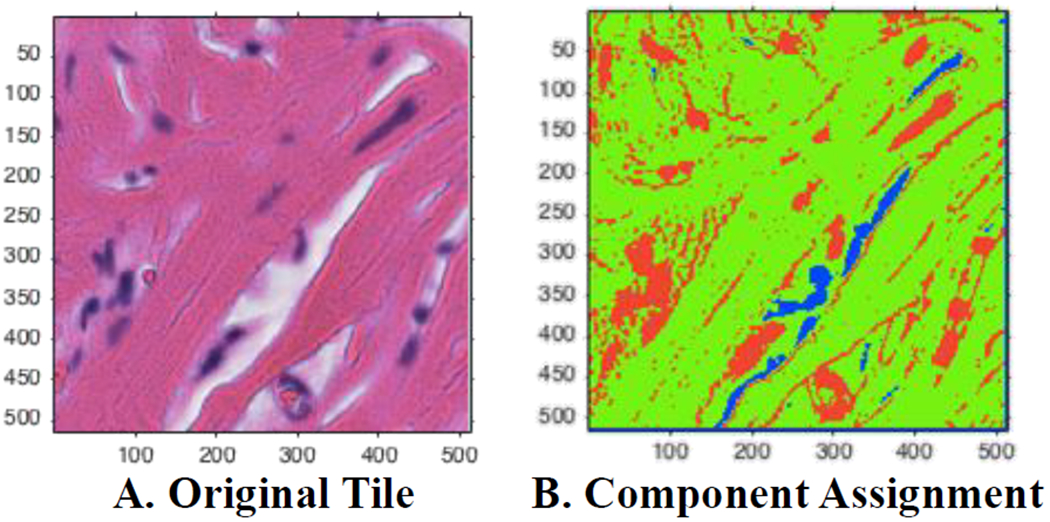
Fig. 2:

Visualization of automated Gaussian mixture model assignments. (A) A sample tile with H&E staining. (B) Assigned pixels based on posterior probabilities. Green corresponds to the eosin/pink component, red assigned to the hematoxylin/purple, and blue corresponds to the background/white component.
