
Figure 6. Model prediction and experimental validation.
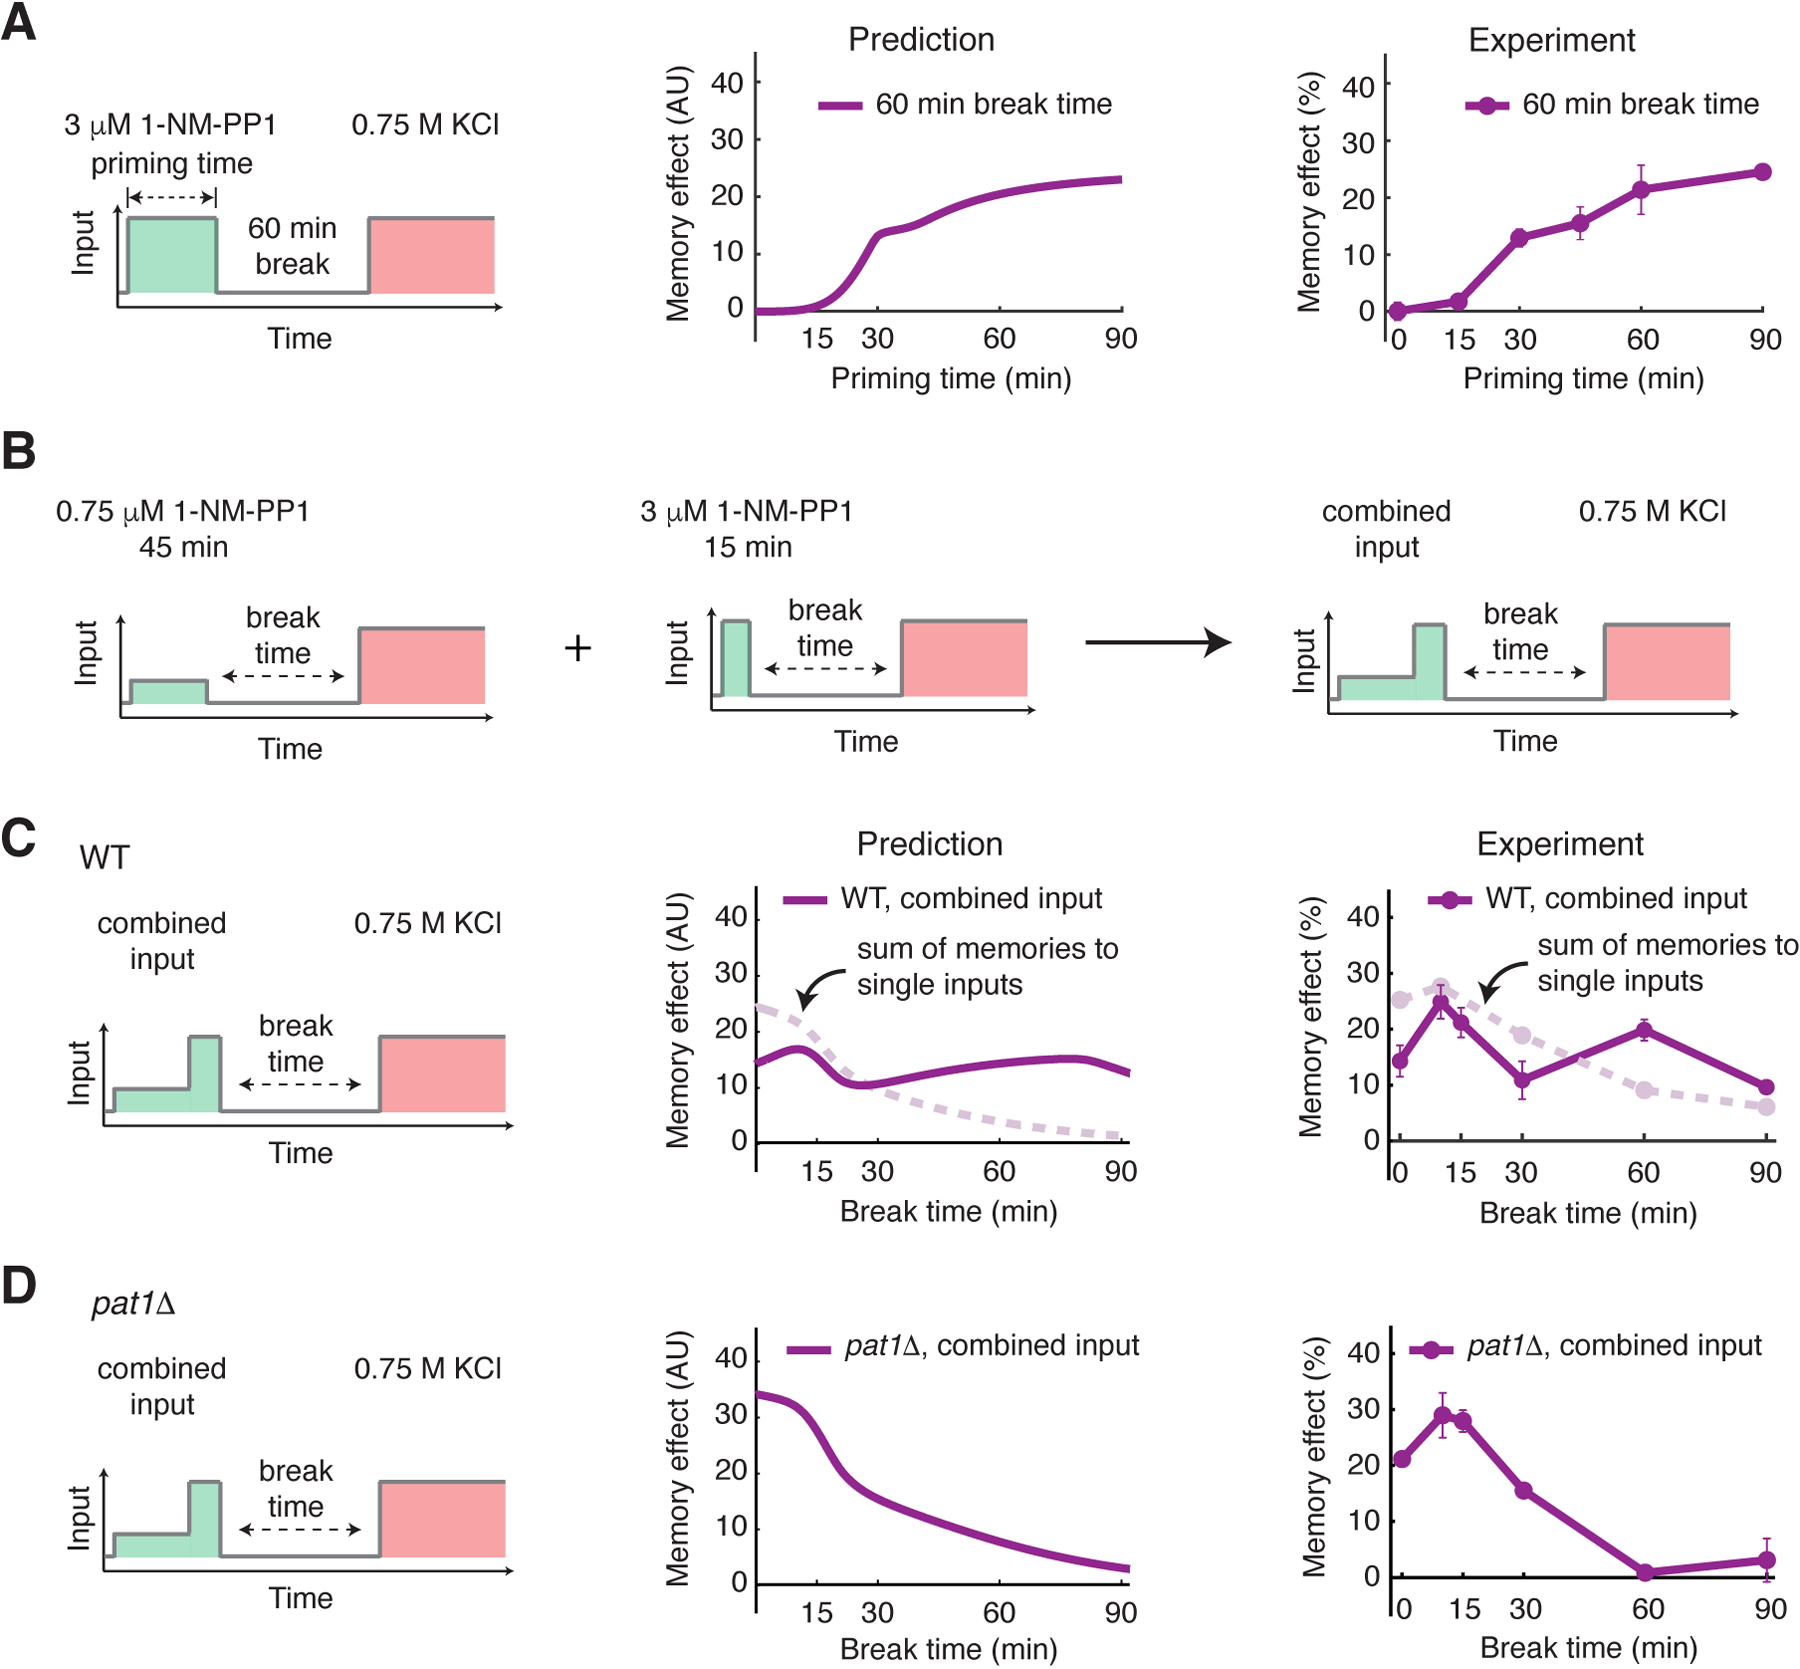
(A) Model prediction and experimental validation of memory effect as a function of priming input duration (60 min break time). Left, schematic illustrating the treatment procedure. Middle, plot showing the predicted memory effects with increasing priming input durations. Right, plot showing the experimentally measured memory effects with increasing priming input durations. (B) A diagram illustrating the temporally combined input. Two single inputs (45 min, 0.75 μM 1-NM-PP1 and 15 min, 3 μM 1-NM-PP1) were applied sequentially to produce the combined input (45 min, 0.75 μM 1-NM-PP1 followed by 15 min, 3 μM 1-NM-PP1). (C) Model prediction and experimental validation of memory dynamics in WT cells in response to the combined input. Left, schematic illustrating the treatment procedure. Middle, plot showing the predicted memory dynamics in response to the combined input. Dashed line in light pink reproduces the sum of memories to two single inputs from Figs. 5A and 5B and was included in the plot for comparison. Right, plot showing the experimentally measured memory dynamics in WT cells in response to the combined input. Dashed line in light pink reproduces the sum of memories to two single inputs from Figs. 2B and 2E and was included in the plot for comparison. (D) Model prediction and experimental validation of memory dynamics in pat1Δ cells in response to the combined input.