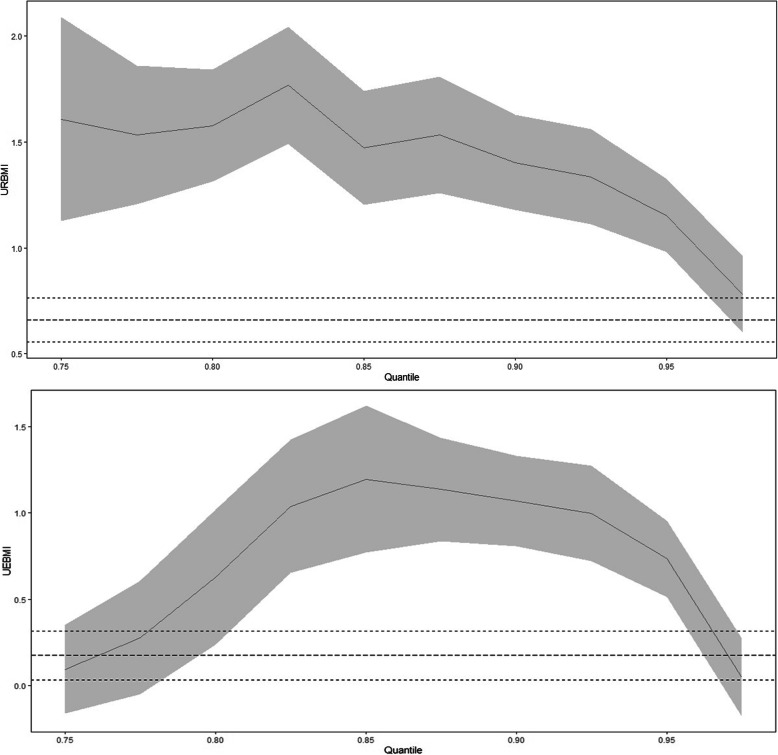
Fig. 2.
Linear quantile mixed regression results. The long-dashed line in the figure is the estimated value of the coefficient of each variable linear mixed model. The short-dashed line indicates the confidence interval of the linear mixed model estimation. The solid line represents the estimated value of the linear quantile mixed regression coefficient of each variable, and the shaded part refers to the confidence interval of the linear quantile mixed regression (linear mixed model and confidence interval of linear quantile mixed regression is 0.95)

