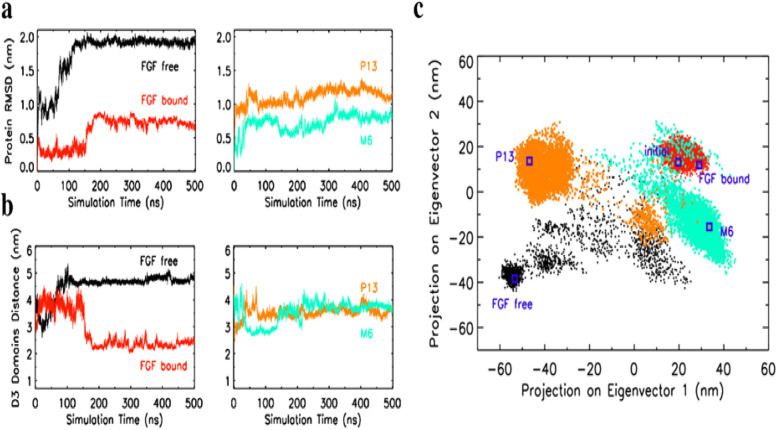
Fig. 8.
Analysis of structural changes of FGFR under different ligand conditions: FGF-free, FGF-bound, P13, and M6. a The root-mean-squared deviation (RMSD) of the protein backbone in reference to its initial structure. b The center-of-mass separation distance between the D3 domains of the two FGFR chains. c Two-dimensional projection of the four combined trajectories (FGF-free, FGF-bound, P13, and M6) on the first and second PCA modes computed from the coordinates of FGFR backbone atoms. The square symbols indicate positions of protein conformations in terms of PCA coordinates for the initial (all trajectories have the same initial protein conformation) and the final state (500 ns) of each trajectory. Color codes for trajectory: FGF-bound (red), FGF-free (black), P13 (orange), M6 (cyan)

