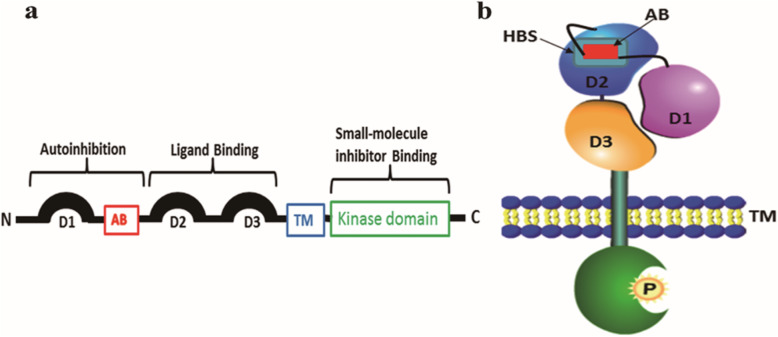
Fig. 9.
Schematic diagram and autoinhibition model of FGFR. a Schematic diagram of FGFR: The “AB” in red stands for acid box, and TM represents the transmembrane domain. Kinase domain phosphorylates downstream molecules and can be inhibited by small-molecule inhibitors. The extracellular region of FGFR is involved in receptor autoinhibition, and the ligand-binding is indicated. The N- and C-terminals are labeled N and C, respectively. b Autoinhibition model of FGFR: The HBS is the heparin-binding site. AB binds to the HBS of D2 to inhibit the activation of FGFR. Figure source adopted from Mohammadi et al. [47, 48] and modified by Rui MA

