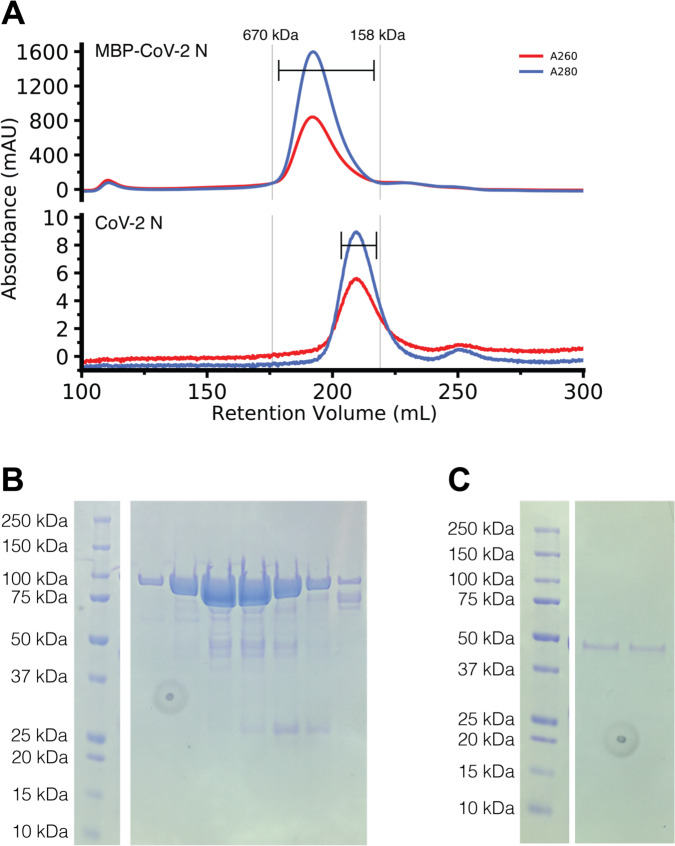
Figure 2: MBP-CoV-2 N and cleaved CoV-2 N elute larger than their predicted molecular weights.
A) Gel filtration chromatogram of ~7ml of ~500 μM MBP tagged CoV-2 N (top) and ~300μl ~50 μM CoV-2 N (previously cleaved from MBP) (bottom). Vertical lines represent peak elution volumes of gel filtration protein calibration standards. Brackets represent range of gels lanes. Predicted molecular weight of the tagged and untagged N are 90 kDa and 46 kDa respectively, much smaller than their corresponding calibrated peak elution volumes, consistent with oligomerization. B) SDS-PAGE showing the peak fractions of the MBP-CoV-2 N chromatogram showing expected 90 kDa MW. C) SDS-PAGE showing the peak fractions of the cleaved CoV-2 N chromatogram showing expected 46 kDa MW. Circular feature in SDS-PAGE gels is a divet in plastic on which pictures were taken.

