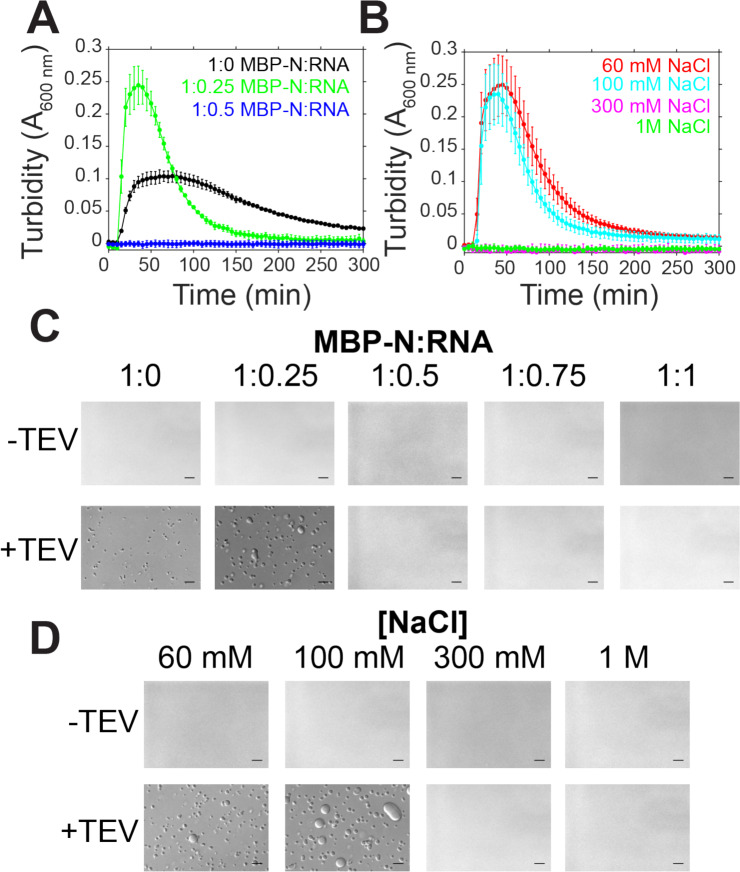
Figure 4: SARS-CoV-2 N LLPS is modulated by salt and RNA.
A-B) Phase separation over time as monitored by turbidity of 50 μM MBP-N in 50 mM Tris pH 7.4 after addition of TEV protease with varying torula yeast RNA (at 100 mM sodium chloride) or varying sodium chloride concentrations. C-D) DIC micrographs of 50 μM MBP-N in 50 mM Tris NaCl pH 7.4 with varying torula yeast RNA or sodium chloride concentrations with and without TEV protease (to cleave MBP from N). Scale bars represent 50 μm.

