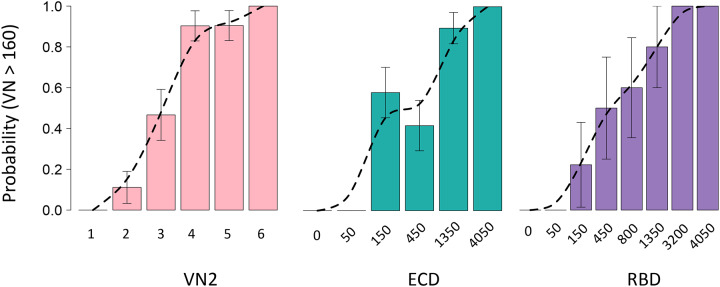
Fig. 2.
Bar plots reporting the prevalence of donors with VN>160 for VN2, ECD or RBD. Probabilities of VN160 were plotted for six range classes, with an interclass interval of 1.8 log2 IC50 values (class 1 - <2; class 2 – 2,12; class 3 −12,42; class 4 – 42-147; class 5 – 147,512; class 6 - >512) or observed classes for ECD (n = 6) and RBD (n = 8) reciprocal ELISA titers. A spline curve (dotted line, smoothness shape=1) has been fitted to the probability values and standard errors (bars) are reported.

