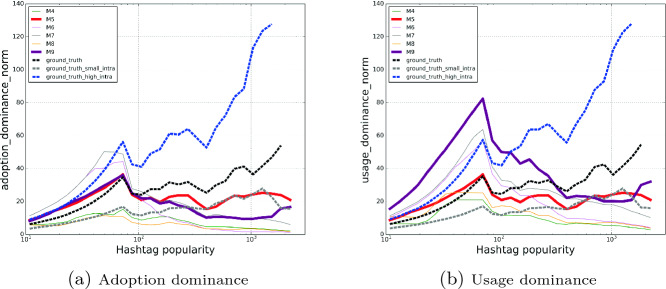
Fig. 3.
Adoption (a) and usage dominance values for models M4–M9. Each line represents changes in proportions of hashtags produced inside adoption ( ) and usage dominant communities (
 ) to number of all hashtags produced in the network. The results are averaged across 30 logarithmic bins and normalized by the random sampling model (M1). ground_truth represents ground truth spreading including all hashtags. The series: ground_truth_small_intra and ground_truth_high_intra show the results for hashtags with
  lower and higher than average, accordingly. The standard error slightly exceeds 2% only for one model. For the rest of the models, as well as for the ground truth, its value is below 1%.

