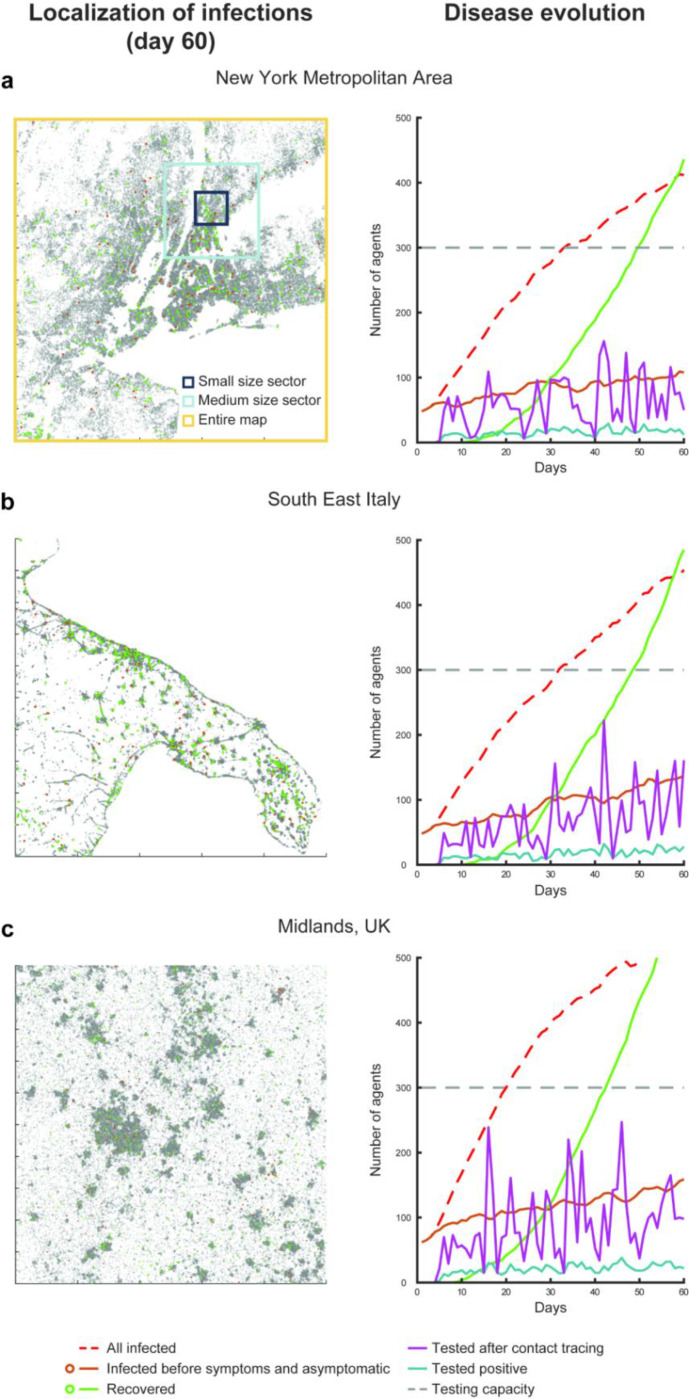
Figure 2. Simulated evolution of the virus transmission over three regions.
Illustration of three different simulations for the scenario 1 (random seed 1) for the maps of New York metropolitan area (a), southeast Italy (b) and the Midlands in UK (c). All simulations display the (failed) containment of the disease transmission relying only on contact tracing, testing and isolation, under the conditions of medium incidence (25% daily increase in the number of infections), 20% contact tracing and testing efficacy and a distribution of travel cohorts of 40%, 30% and 30% for the short, medium and long travel range (respectively illustrated as black, blue and yellow squares in panel a).

