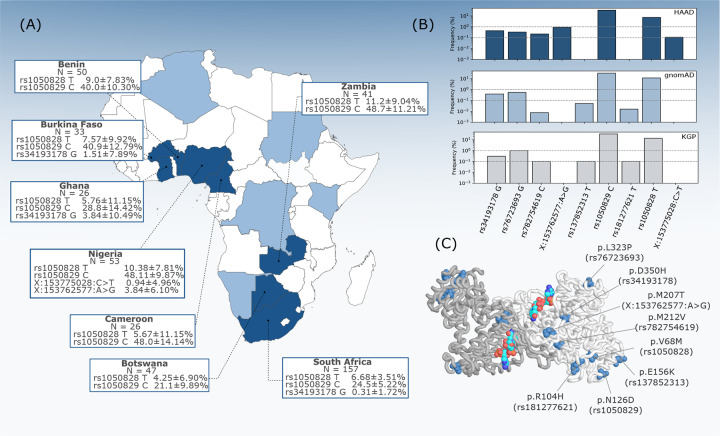
Figure 1:
G6PD missense variant distribution across African populations. (A) G6PD allele frequencies in populations from HAAD countries. Confidence intervals for allele frequencies based on the equal or given proportions test the 95% significance level. (B) Allele frequencies of missense variants in HAAD, and African superpopulation groups from gnomAD and the KGP. (C) Structural representation of the G6PD homodimer with missense residues highlighted in blue color on both chains with bound NADP (NADP shown in red-turquoise-blue).

