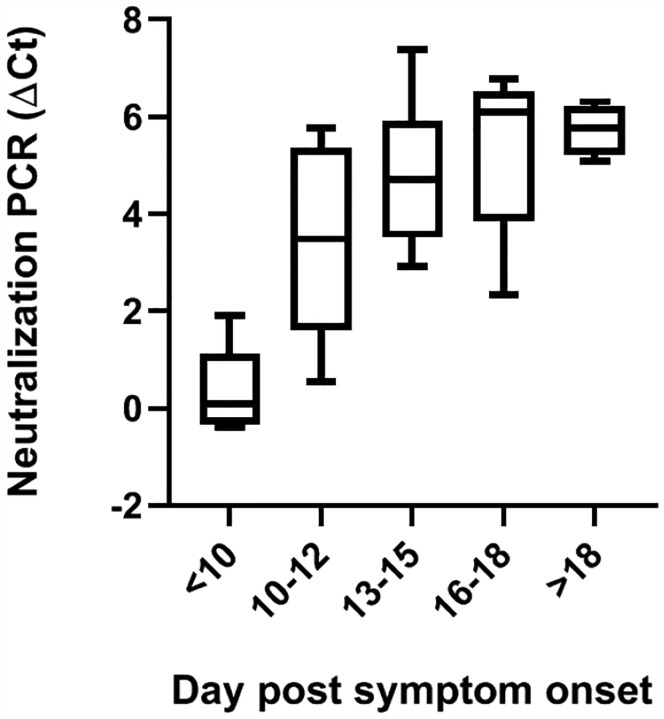
Figure 4. Evaluation of kinetics of NAb development by neutralization PCR assay.
Sera from COVID-19 patients after different days post symptom onset were tested by neutralization PCR assay. All sera samples (N=28) were from unique individuals. The boxplots show medians (middle line) and third and first quartiles (boxes), while the whiskers show minimum and maximum above and below the box.

