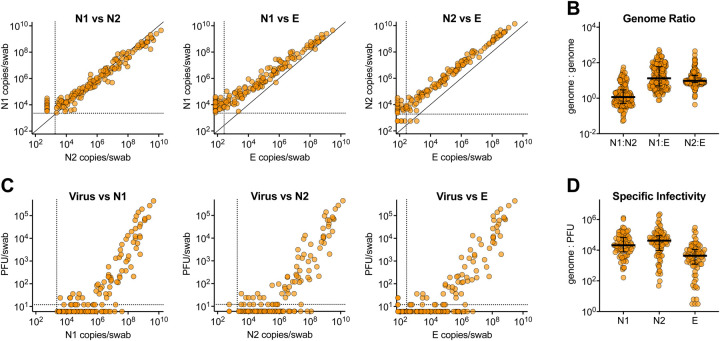
Figure 2. Relationship between SARS-CoV-2 viral RNA and infectious virus.
Samples with detectable SARS-CoV-2 N1 vRNA were evaluated for N2 and E vRNA and infectious virus. A) Relationship between levels of N1, N2 and E vRNA transcripts. B) Genome:genome ratios between N1:N2, N1:E and N2:E (median with interquartile range). C) Relationship between levels of infectious virus and N1, N2, and E vRNA levels. D) Specific infectivity (genome:PFU ratio) of infectious virus relative to N1, N2 and E transcripts (median with interquartile range). Dashed lines represent limits of detection. PFU, plaque forming units.

