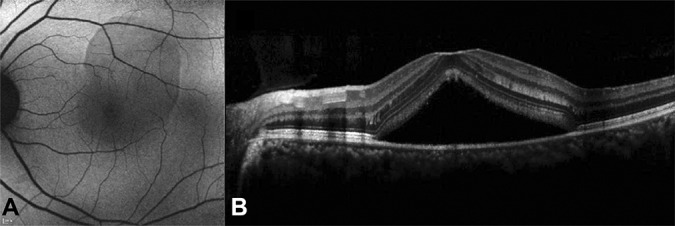
Fig. 1.

Fundus autofluorescence image (A) shows a homogeneous background fluorescence and a uniform change from the FAF of the normal background (blocked FAF). There is a decrease in the FAF intensity where the SRF existed and shows uniform changes. Spectral domain optical coherence tomography image (B) shows SRF in the region where the FAF intensity decreased.
