Figure 5.
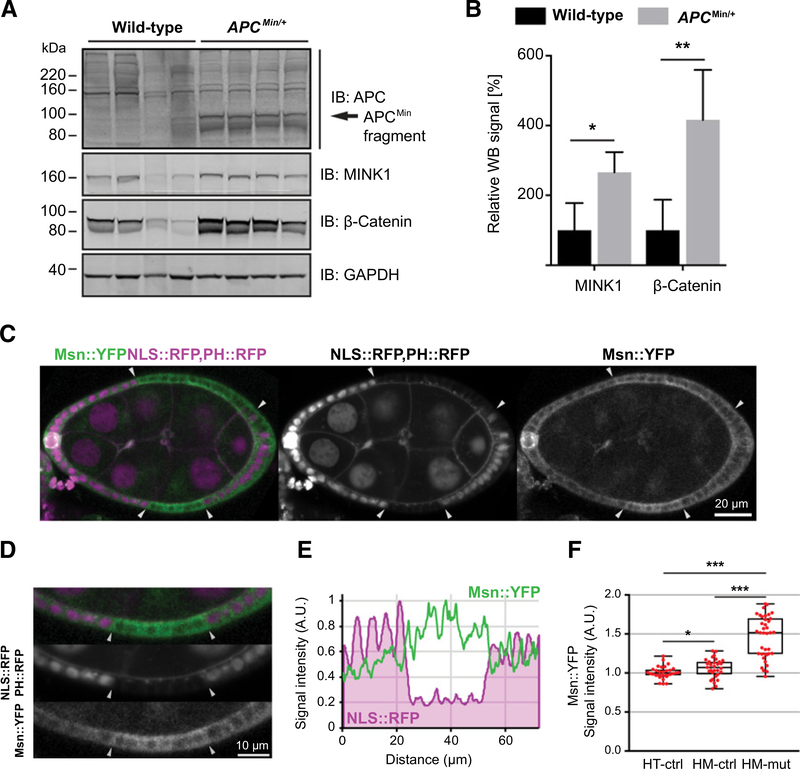
MINK1/Msn levels increase in response to APC loss in vivo. A, Expression of MINK1 in small intestinal tissue lysate from WT and APCMin/+ mice measured by WB; each lane represents lysate obtained from individual mice. The APCMin fragment of approximately 90 kDa was present in mutant mice, but full-length APC (~310 kDa) was not detectable. B, Quantification of WB shown in A. Shown is the mean WB signal across the 4 mice per genotype relative to the signal in WT mice and normalized to GAPDH. Significance relative to WT samples determined by unpaired, two-tailed t test (*, P < 0.05; **, P < 0.01). C, Live stage 8 Drosophila egg expressing NLS::RFP and PH::RFP (magenta) under the control of a ubiquitous promoter, and endogenous Msn::YFP (green). Two large APC1, APC2 double mutant clones within the follicular epithelium are identified by the absence of NLS::RFP and delimited by arrowheads. D, Magnification of one APC1, APC2 double mutant clone displayed in C. E, Intensity profiles of RFP and Msn::YFP signal along the follicular epithelium. F, Msn signal intensity at the interface between apc1−, apc2−/apc1+, apc2+ heterozygous cells (HT-ctrl, n = 31), apc1+, apc2+/apc1+, apc2+ homozygous control cells (HM-ctrl, n = 31), and apc1−, apc2−/apc1−, apc2− homozygous mutant cells (HM-mut, n = 38), normalized to the signal at heterozygous interfaces. In total, 10 clones from 10 different egg chambers were analyzed. Significance determined by two-tailed Mann-Whitney U test (*, P = 0.0232; ***, P < 0.00001).

