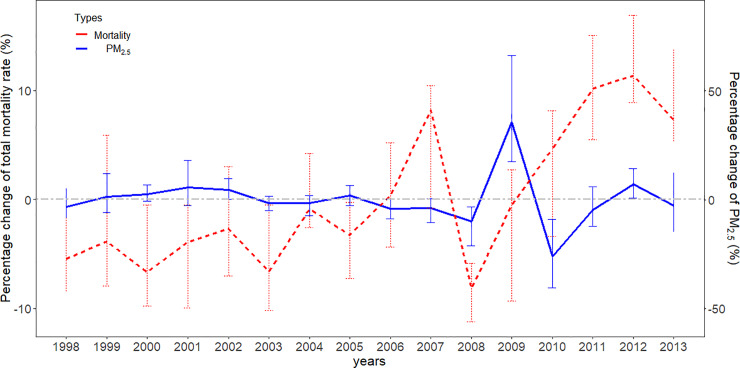
Fig 2. The percentage changes in mortality rate and PM2.5 concentrations in area units during 1998–2013.
The percentage changes are the percent difference between the values of PM2.5 or mortality rate (per 1,000 persons) in area unit specific to each year and the average of the values from 1998 to 2013 in the same area unit, divided by the average of the values in area unit specific to the time from 1998 to 2013. The error bars for both lines are the range (maximum–minimum) of all areas. PM2.5, fine particulate matter (particulate matter with a diameter of <2.5 μm).

