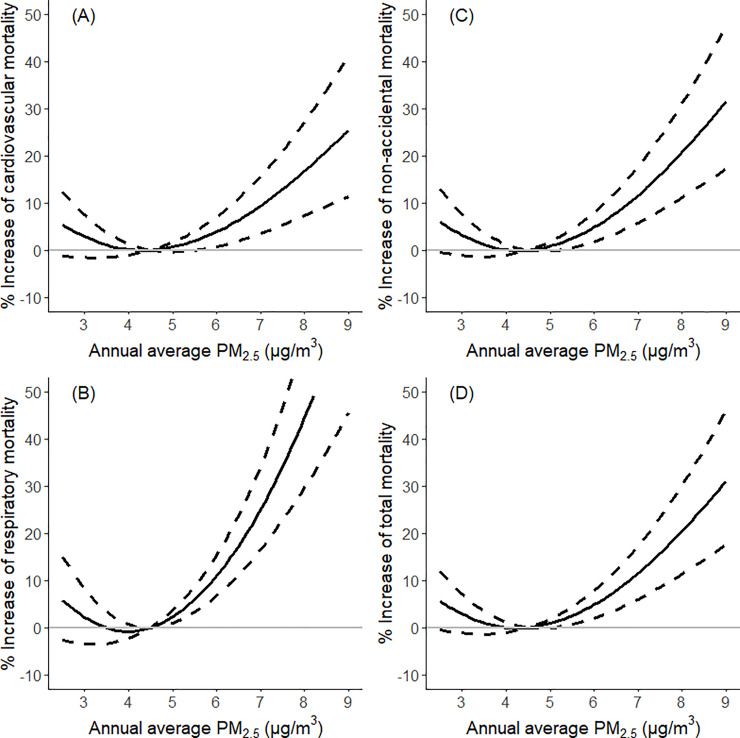
Fig 4. The association between annual average PM2.5 and the increase of cause-specific/total mortality in Queensland from 1998 to 2013.
The association was examined using cubic splines with 3 degrees of freedom in generalized nonlinear models. Dotted lines: 95% CI; (A) cardiovascular causes: ICD-9: 390–459; ICD-10: I00–I99; (B) respiratory causes: ICD-9: 460–519; ICD-10: J00-J99; (C) non-accidental causes: ICD-10: F00–F99, G00–G99, I00–I99, J00–J99, K00–K93, N00–N99; and (D) total mortality: ICD-10: F00–F99, G00–G99, I00–I99, J00–J99, K00–K93, N00–N99, V01–Y98. PM2.5, fine particulate matter (particulate matter with a diameter of <2.5 μm).

