. 2020 Jun 18;128(6):067013. doi: 10.1289/EHP5304

Figure 5.

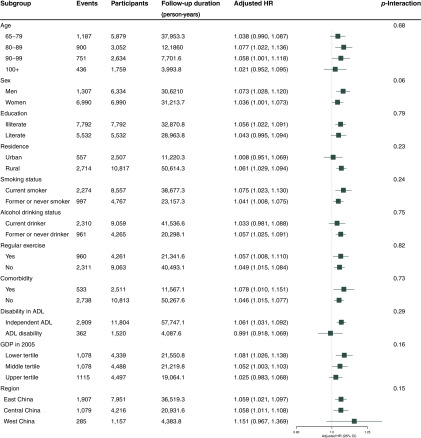
Figure 5 is a set of 11 graphs, plotting subgroups, namely, age (65 to 79, 80 to 89, 90 to 99, and 100 plus years), sex (Men and Women), Education (illiterate and literate), residence (urban and rural), smoking status (current smoker and former or never smoker), Alcohol drinking status (current drinker and former or never drinker), regular exercise (yes and no), comorbidity (yes and no), disability in ADL (independent ADL and ADL disability), GDP in 2005 (lower tertile, middle tertile, and upper tertile), and region (east China, central china, and west China; y-axis), respectively, across adjusted HR (95 percent CI), ranging from 0.80 to 1.25 in increments of 0.25 (x-axis).

Stratified analyses of association of each 10-μg/m3 increase in particulate matter with aerodynamic diameter 2.5μm (PM2.5) concentration with poor cognitive function (Mini-Mental State Examination (MMSE) score<18) in competing risk models among Chinese older adults of 65 years of age and older. Adjusted covariates include age (continuous), sex, residence, current marital status, living pattern, education (literacy status), smoking status, alcohol drinking status, regular exercise, diabetes, heart disease, hypertension, respiratory disease, disability in activities of daily living, gross domestic product (GDP), physicians per z persons at the prefecture level. Note: CI, confidence interval; HR, hazard ratio.