
Figure 2.
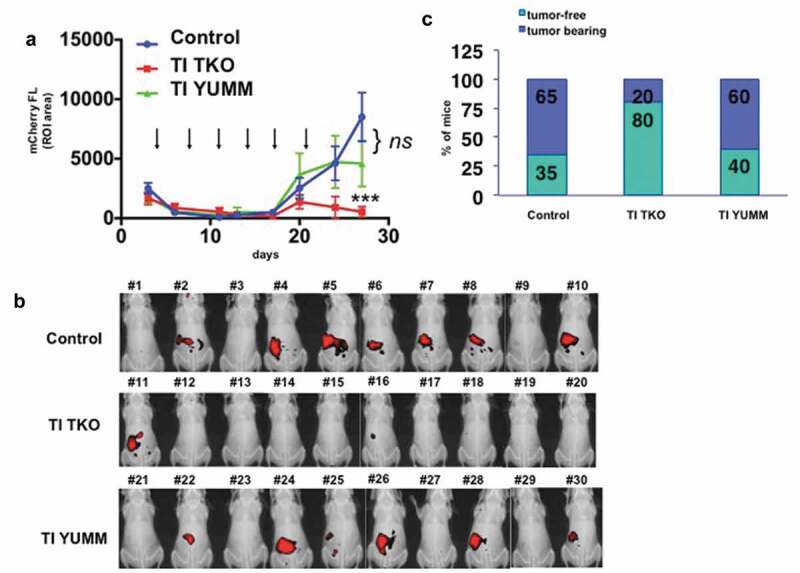
Transimmunization prevents recurrence. Mice bearing i.p. tumors were randomized into three groups 4 days after inoculation of cancer cells: group 1) PBS control (n = 20), group 2) TI TKO (n = 10), and group 3) TI YUMM (n = 10). Treatment was administered as described in the Materials and methods section. a. Tumor growth curves showing mCherry FL ROI area. Data are presented as mean ± SEM. Arrow indicates administration of treatment; **** p < .0001 PBS control vs TI TKO; ns, p = .1079 PBS control vs TI YUMM by Two-Way ANOVA. b. Live imaging of animals on day 27 showing mCherry fluorescence signal as a surrogate for i.p. tumor burden. Ten animals are shown per group; c. Graphical representation of tumor incidence by live animal imaging.