Figure 8.

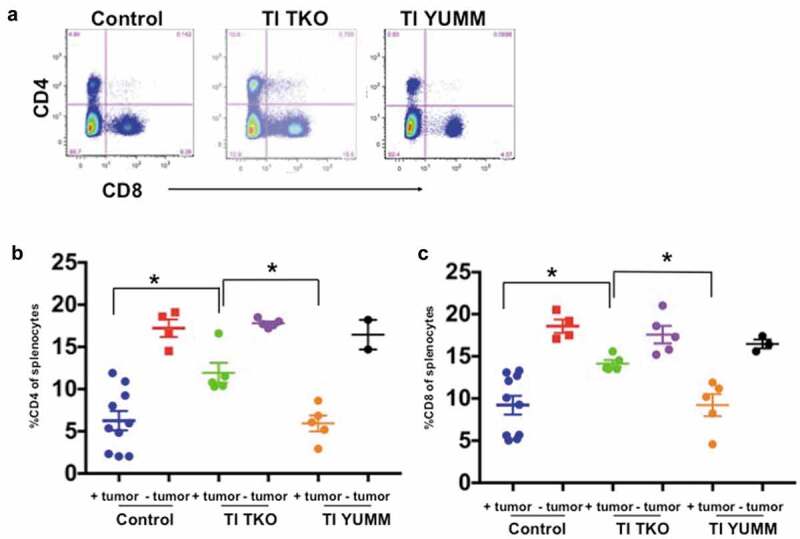
Transimmunization enhances systemic CD4 and CD8 T cell proliferation. Splenocytes were collected at the end of the study and analyzed by flow cytometry for CD4 and CD8. a. Representative dot plot images showing quadrant analysis for CD4 and CD8 in the different groups. b. Graphical representation of the percentage of CD4 cells. Data are presented as mean ± SEM; * p < .05. c. Graphical representation of the percentage of CD8 cells. Data are presented as mean ± SEM; * p < .05. Statistical analysis is performed using Ordinary One-way ANOVA with Tukey post hoc analysis.
