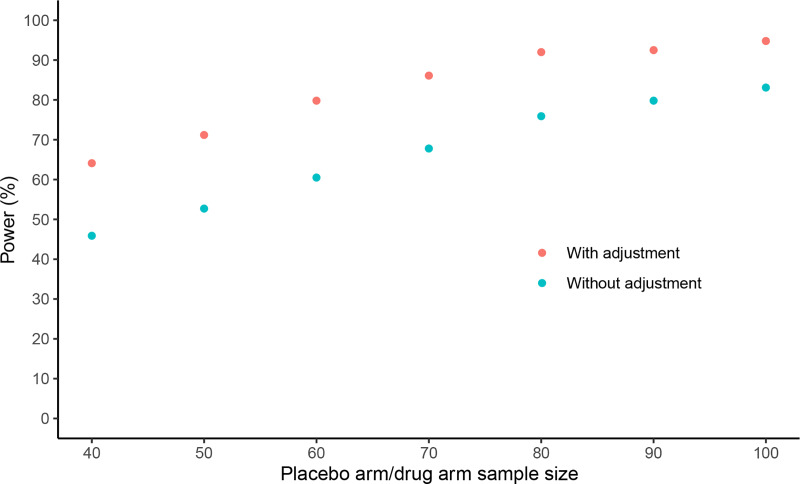
Fig 2. Power to detect a treatment effect of 0.25 stairs/second with and without adjustment for prognostic score under different trial arm sample sizes, assuming the SD of Δ4SC velocity is 0.6.
Δ4SC, annualized change in 4-stair climb; SD, standard deviation. Δ4SC velocity = (4SC velocity at outcome visit - 4SC velocity at baseline visit)/ time in years between outcome and baseline visits. Δ4SC velocity > 0 indicates improved performance; Δ4SC velocity < 0 indicates worsened performance. R-squared due to prognostic model assumed to be 0.35 in all scenarios. While a SD of Δ4SC velocity of 0.6 was used for this illustration, a similar pattern of greater power to detect a treatment effect when adjustment is made for the prognostic score also holds for lower and higher SDs of Δ4SC velocity (S3 and S4 Figs).

