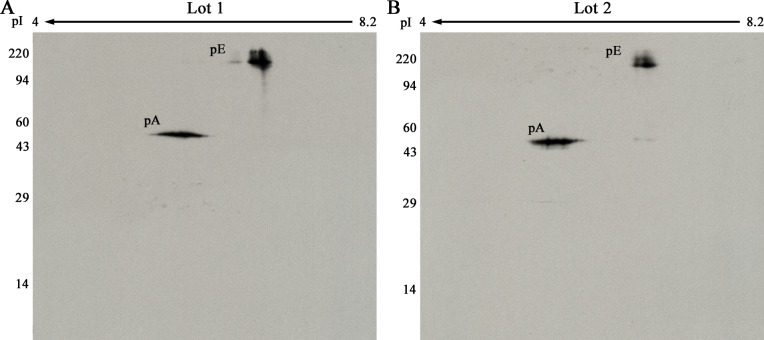
Fig 7.
2D pTyr WB with 20 μl of pE Lot 1 (A) or Lot 2 (B) plus 2 ng of pA. The molecular weight range is shown on the left, direction of isoelectric focusing on the top. The pE spot is fuzzy because of charge and molecular weight heterogeniety due to glycosylation [15].

