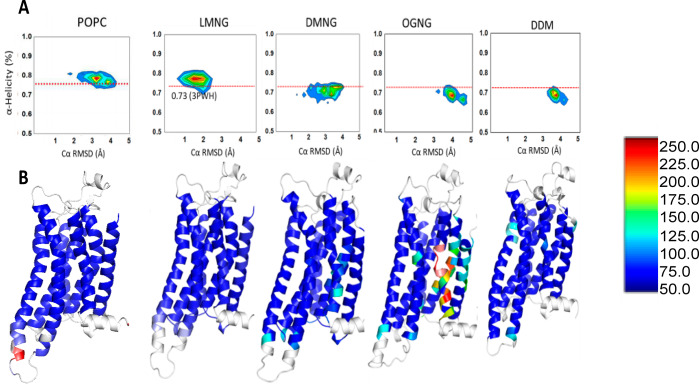
Figure 3.
Conformational heterogeneity of the inactive state of tA2AR in the POPC lipid bilayer, LMNG, DMNG, OGNG, and DDM. (A) Distributions of the average helicity of all TM region residues and RMSD (root-mean-square deviation) of each MD snapshot of tA2AR. Simulations of tA2AR (PDB entry 3PWH) were performed in POPC, LMNG, DMNG, OGNG, and DDM micelles. The red dotted lines in the figure show the average helicity of the crystal structure of tA2AR. (B) Residue-based thermal B-factor calculated from the RMSF (root-mean-square fluctuation) of tA2AR from the MD simulations in POPC, LMNG, DMNG, OGNG, and DDM detergent complexes shown as a heat map. The loop regions and helix 8 colored white have been omitted from the representation for the sake of clarity.

