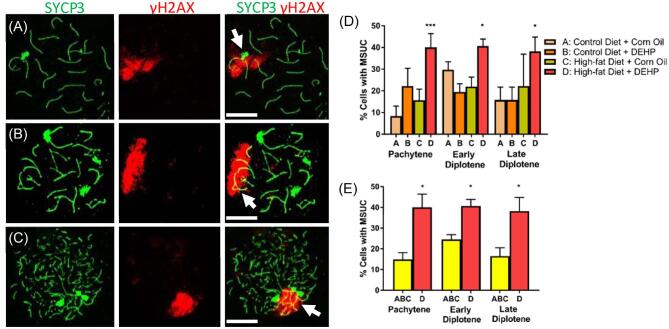
Figure 1.
Representative images for fetal oocytes at the pachynema (A), early diplonema (B), and late diplonema (C) containing MSUC (arrows). (D) Percentage of pachytene, early diplotene, and late diplotene fetal oocytes with MSUC in A group (control diet 460 + corn oil) (n = 232 oocytes), B group (control diet + DEHP) (n = 178 oocytes), C group (high-fat diet + corn oil) (n = 151 oocytes), and D group (high-fat diet + DEHP) (n = 351 oocytes). Differences within treatment groups in % MSUC at each stage were evaluated using the A group as a reference (*P < 0.05, ***P < 0.001). (E) Comparison of MSUC percentage of D group with combined A, B, and C controls (*P < 0.05). Graphs represent means ± SEM. Scale bars = 10 μm.

