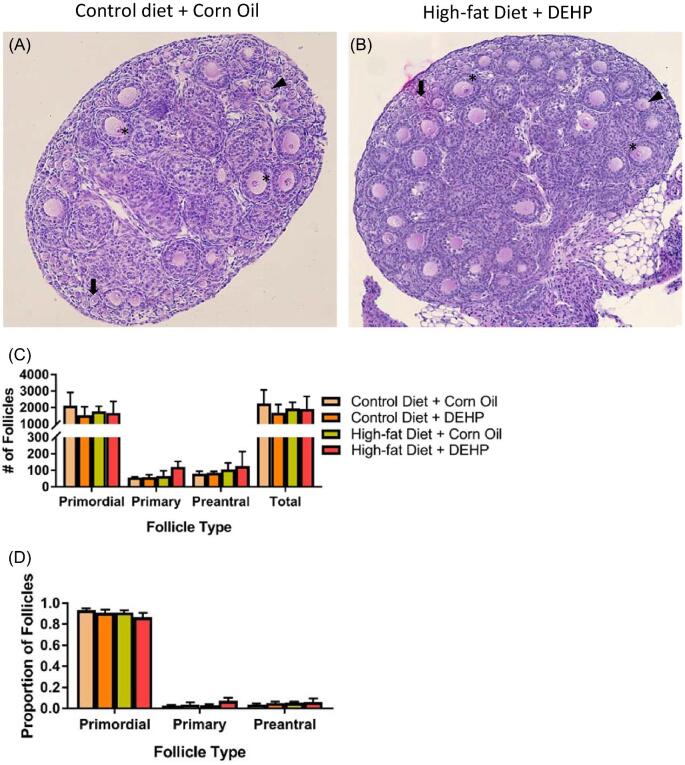
Figure 2.
PND 8 ovarian section in A group (control diet + corn oil) (A) and B group (high-fat diet + DEHP) (B) stained with hematoxylin and eosin. Some primordial (arrows), primary (arrow heads), and preantral (asterisks) follicles have been demarcated. (C) Counts of primordial, primary, and preantral follicles for each treatment group at PND 8 (n = 3 dams/treatment group). (D) Follicular progression of PND 8 ovaries, as measured by the proportions of primordial, primary, and preantral follicles in each treatment group. Proportions were gathered separately for each ovary. Graphs represent means ± SD.

