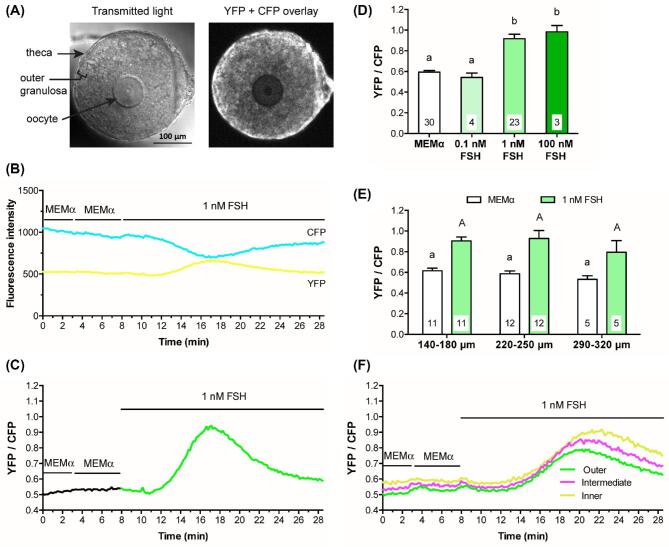
Figure 1.
FSH increases intracellular Ca2+ in the mural granulosa cells of intact follicles, as detected by Twitch-2B. (A) Representative transmitted light and CFP + YFP fluorescence images of a follicle after a 28-h culture on a Millicell membrane. Prior to flattening on the membrane, the follicle measured ∼180 μm in diameter. Note that the residual theca cells that surround the follicle and that were not removed by dissection show higher fluorescence intensity than the granulosa cells, indicating the presence of more Twitch-2B protein in the theca cells. (B) Representative traces showing changes in YFP and CFP fluorescence before and after perfusion with control medium (MEMα) or 1 nM FSH. Following FSH perfusion, the two channels change in opposite directions, indicating an increase in FRET (same follicle as A). (C) Representative trace showing the YFP/CFP ratio before and after treatment with 1 nM FSH (same follicle as B). The increase in YFP/CFP ratio indicates that 1 nM FSH induces a transient Ca2+ increase in the granulosa cells. (D) Both 1 nM and 100 nM FSH induce Ca2+ increases of similar magnitude. Peak YFP/CFP ratios during perfusion of control medium (MEMα) and the indicated concentrations of FSH. Follicle diameters at the time of isolation from the ovary were 140–250 μm. (E) The Ca2+ response to 1 nM FSH is similar in follicles of different sizes. Peak YFP/CFP ratios before and after perfusion of 1 nM FSH, for follicles of the indicated diameters (those in the 140–180 μm and 220–250 μm groups are the same follicles as in A). Numbers within the bars indicate the number of follicles tested. Different letters indicate significant differences (P < 0.05) after one-way ANOVA (D) or two-way ANOVA (E), followed by t-tests with the Holm-Sidak correction for multiple comparisons. For (E), lowercase letters indicate comparisons among MEMα groups; uppercase letters reflect comparisons between groups treated with FSH. All values represent mean ± s.e.m. (F) The FSH-induced Ca2+ rise is similar in different regions of preantral follicles. Traces show fluorescence intensity as a function of time for 3 concentric regions of a representative follicle: in the outer 25 μm (green), the middle 25–50 μm (magenta), and the inner 25 μm (yellow). The follicle used for these measurements was 160 μm in diameter at the time of isolation. Similar records were obtained from six other follicles with diameters ranging from 140 to 220 μm.

