Figure 2.
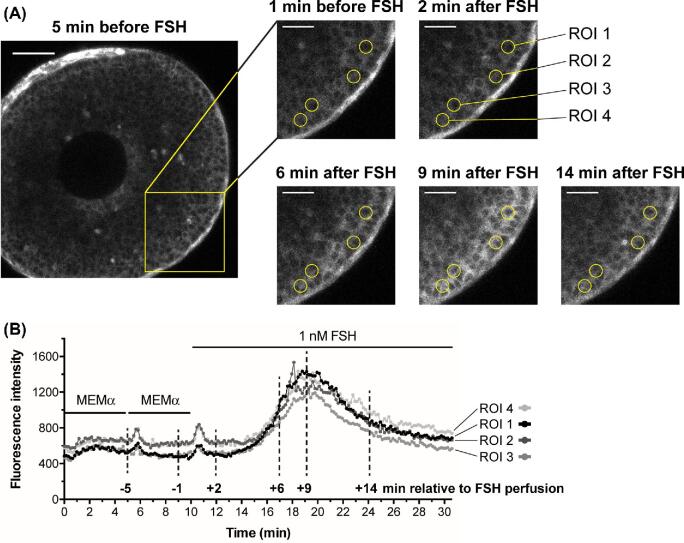
FSH increases Ca2+ uniformly in all outer granulosa cells, as detected with GCaMP6s. (A) A small antral follicle from a mouse expressing the GCaMP6s Ca2+ sensor (∼220 μm-diameter at the time of isolation 24 h previously). GCaMP6s fluorescence intensity increases with increasing Ca2+ levels, allowing Ca2+ rises in individual cells to be visualized. The yellow box shows the area of enlargements at different time points before and after FSH perfusion; the time points corresponding to these images are marked on the traces in (B) with vertical dashed lines. Yellow circles highlight the regions of interest (ROIs) (10 μm diameter), positioned approximately over single cells, that were measured to generate the traces in (B). Note that after FSH, the entire outer granulosa layer increases in brightness to a similar extent. Scale bar in full image is 50 μm; scale bars in cropped images represent 25 μm. Supplementary movie S1 shows the entire time series from which these images were selected. (B) GCaMP6s fluorescence intensity (relative Ca2+ levels) for each of the four ROIs labeled above. Note that the granulosa cells show a small Ca2+ transient in response to the mechanical stimulus during perfusion, independent of FSH. Representative of six follicles.

