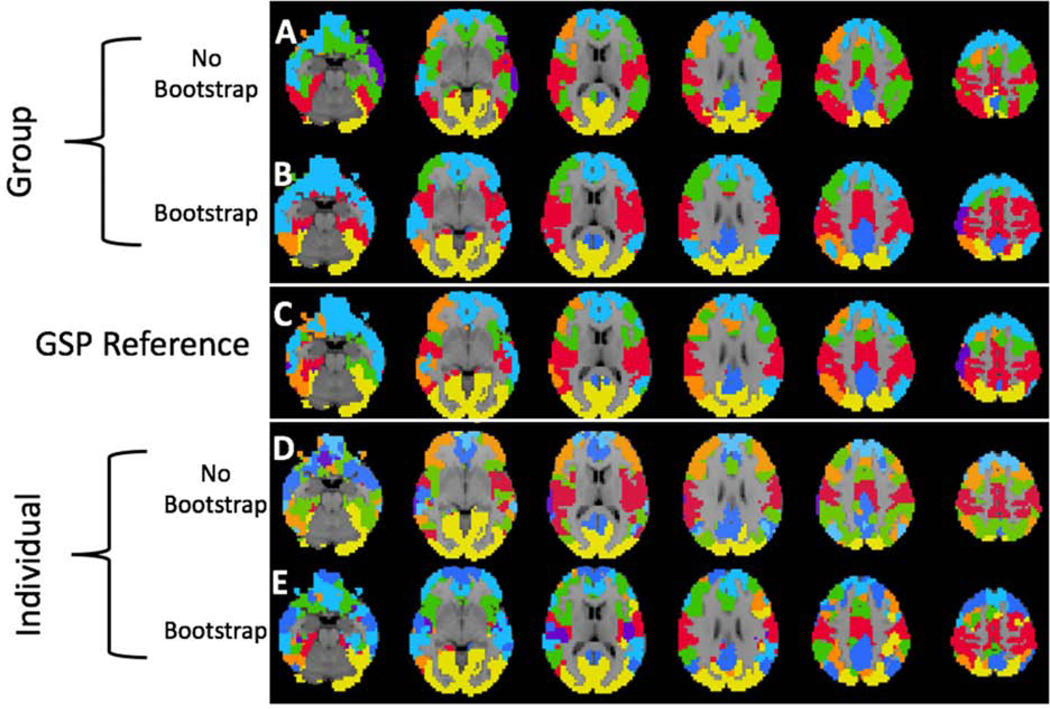
Figure 5-.
Visualization of Group and Individual Level Between Study Cortical Parcellations. We show the similarity of the HNU1 parcellation to the GSP reference parcellation with K = 7 clusters as shown in Figure 3. We use a K-nearest neighbor spatial filter on these parcellations to improve ease of visual comparison. Notably, both the group and individual level parcellations with 400 bootstraps are closer to the GSP reference parcellation than either of the standard parcellations. A) Group-level parcellation with standard approach, and B) bootstrapping. C) GSP Reference parcellation. D) Individual-level parcellation with standard approach, and E) bootstrapping.

