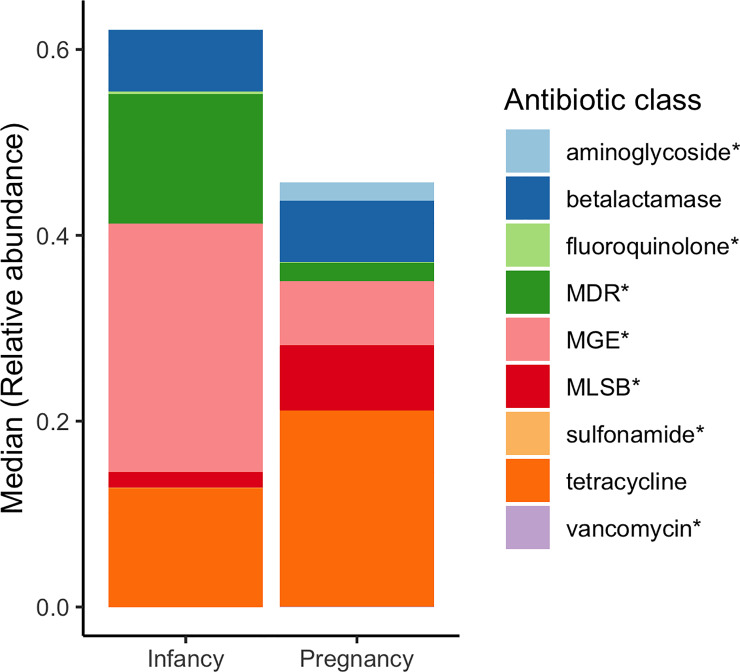
Fig 3. Median relative abundance for each ARG/MGE group in all infant and pregnant samples.
The height of the bars represents the median ARG/MGE relative abundance by groups (infant/pregnant). Colors represent different groups of ARG or MGE. Based on all infant (n = 40) and pregnant (n = 51) samples. * represents statistically significant differences between pregnant and infant samples.

