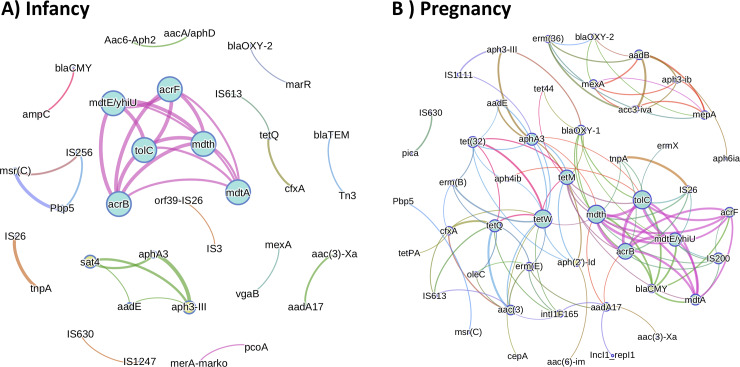
Fig 8. Co-occurrence networking analysis using ARG /MGE log (relative abundances) from infant samples.
Nodes (genes) connected by edges represent Spearman correlations higher than 0.6. Node sizes represent degree of centrality (number of connections). The color of the edges represents an antibiotic resistance class and their thickness represent greater correlation coefficients. A) Based on all infancy (n = 40) samples. B) Based on all pregnancy (n = 51) samples.

