
Figure 4.
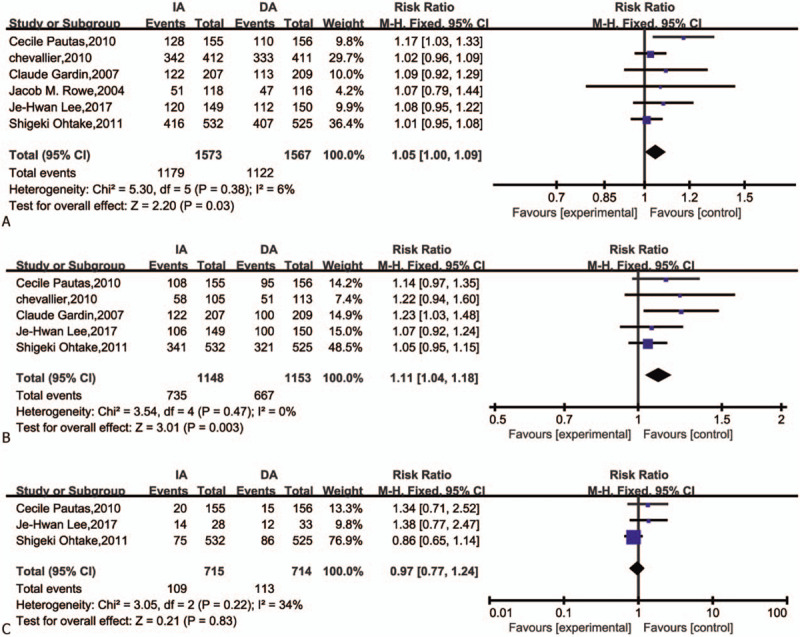
Forest plots of RR for CR, CR1, CR2 (CI = confidence interval, Fixed = fixed-effect model, M–H = Mantel–Haenszel method, RR = risk ratio). (A) CR complete remission; (B) CR1 complete remission in one course; (C) CR2 complete remission in two courses).