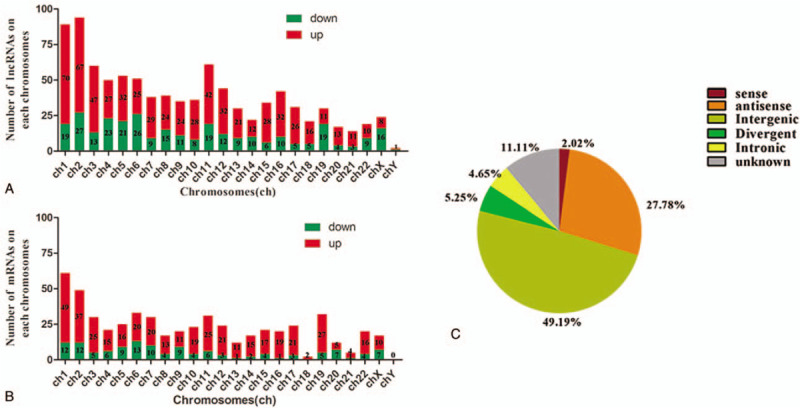
Figure 2.

(A) The number of differential lncRNAs on each chromosome. (B) The number of differential mRNAs on each chromosome. (C) Pie-chart of lncRNA classification. The area in each chart assigns to a constructional category by hypergeometric distribution.
