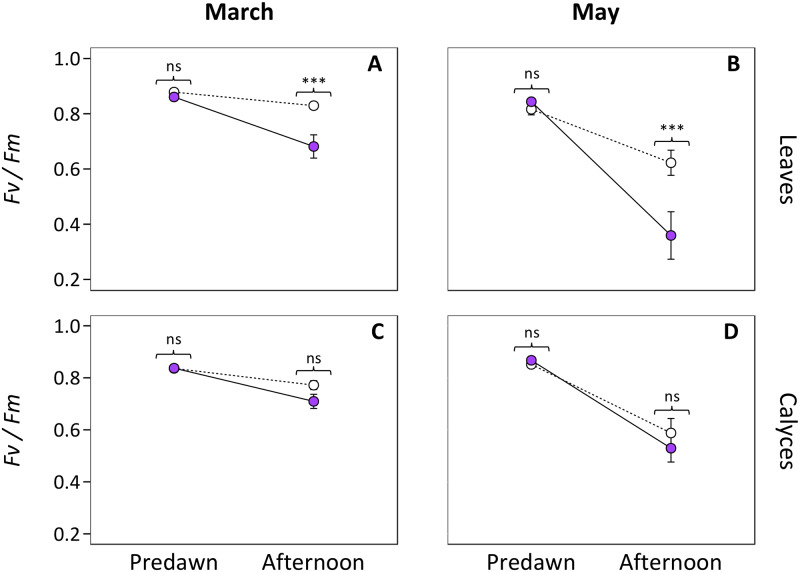
Fig 3. Variation of photochemical efficiency (Fv/Fm) from predawn conditions to afternoon.
The mean Fv/Fm values from leaves (A, B) and calyces (C, D) in the early flowering (March; A and C) and peak flowering (May; B and D) periods are shown. Plants from the UV-present treatment are displayed by pink filled circles and solid lines, whereas those from the UV-exclusion treatment are displayed with empty circles and dashed lines. Statistical results of independent pairwise comparisons using Bonferroni adjustment between UV treatments in predawn and afternoon conditions are displayed. ns, not significant; ***, P < 0.001. Error bars represent ± SE.

