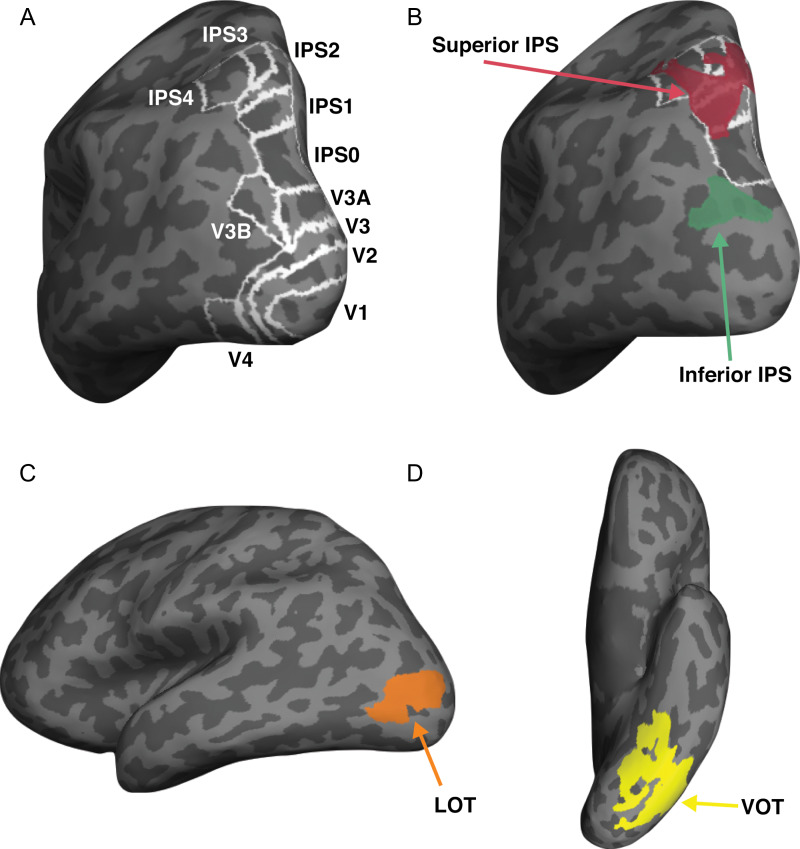
Figure 2.
Inflated brain surface from a representative participant showing the ROIs examined. (A) Topographic ROIs in occipital and parietal cortices. (B) Superior IPS and inferior IPS ROIs, with white outlines showing the overlap between these 2 parietal ROIs and parietal topographic ROIs. (C) LOT and VOT ROIs.

