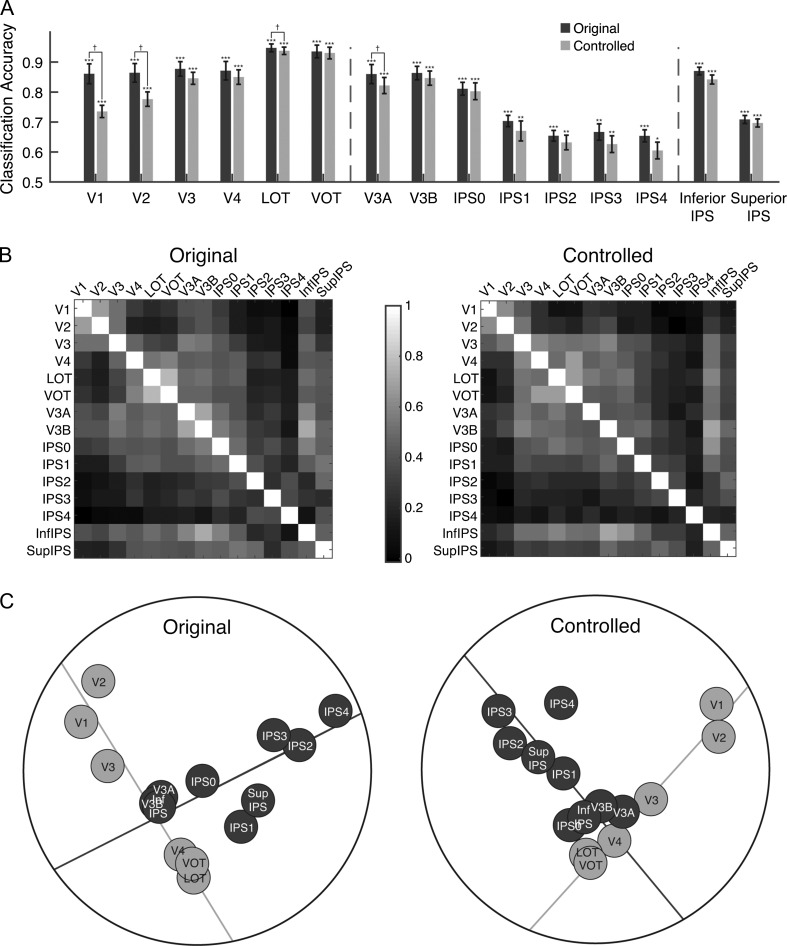
Figure 3.
Results of Experiment 1. (A) fMRI decoding accuracies for the original and controlled stimuli. The left vertical dashed line separates OTC ROIs from PPC ROIs and the right vertical dashed line separates functionally defined PPC ROIs from topographically defined PPC ROIs. Error bars indicate standard errors of the means. Chance level performance equals 0.5. Asterisks show corrected p values (***P < 0.001, **P < 0.01, *P < 0.05, †P < 0.1). (B) The region-wise similarity matrix for the original (left panel) and controlled (right panel) images. Each cell of the matrix depicts the correlation of 2 ROIs in how similar their representations for the 8 natural categories are. Lighter colors show higher correlations. (C) Results of the MDS analysis on the region-wise similarity matrices for the original (left panel) and controlled (right panel) images. The emergence of a 2-pathway structure is prominent in both images. A total least square regression line through the OTC regions (the light gray line) and another through the PPC regions (the dark gray line) were able to account for 79% and 61% of the total amount of variance of the region-wise differences in visual object representation for the original and the controlled object images, respectively. No systematic difference was observed whether original or controlled object images were used.

