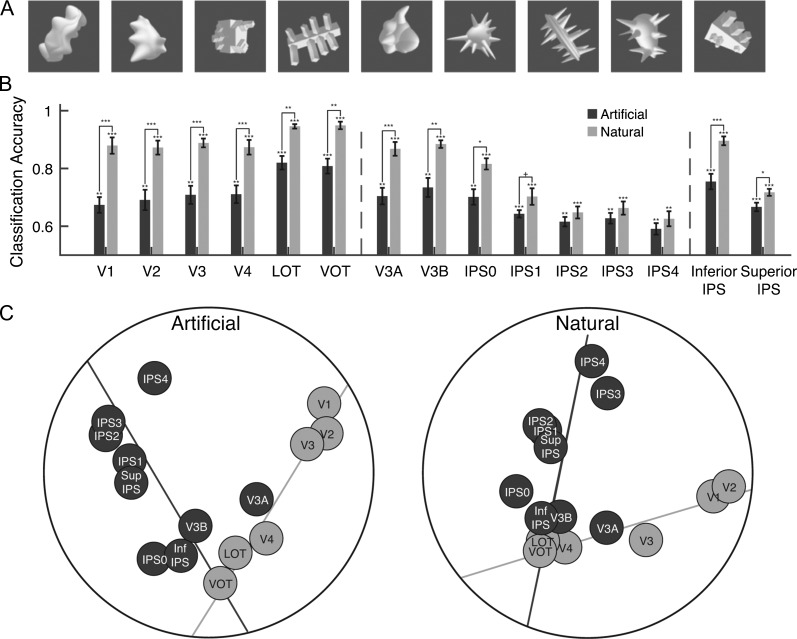
Figure 5.
Comparing natural and artificial object category representations in Experiment 4. (A) Sample images from the 9 artificial object categories. (B) fMRI decoding accuracies for the natural and artificial object categories. The left vertical dashed line separates OTC regions from PPC regions and the right vertical dashed line separates PPC functionally defined regions from PPC topographically defined regions. Error bars indicate standard errors of the means. Chance level performance equals 0.5. Asterisks show corrected P values (***P < 0.001, **P < 0.01, *P < 0.05, †P < 0.1). (C) MDS plots of the region-wise similarity matrices for the artificial (left panel) and natural (right panel) object categories. The 2-pathway structure (i.e., the light and dark gray total least square regression lines through the OTC and PPC regions, respectively) accounted for 64% and 64% of the total amount of variance in region-wise differences in visual object representation for the natural and artificial object categories, respectively, with no systematic difference between the 2. The presence of the 2-pathway structure thus is not driven by the specific natural object categories used.

