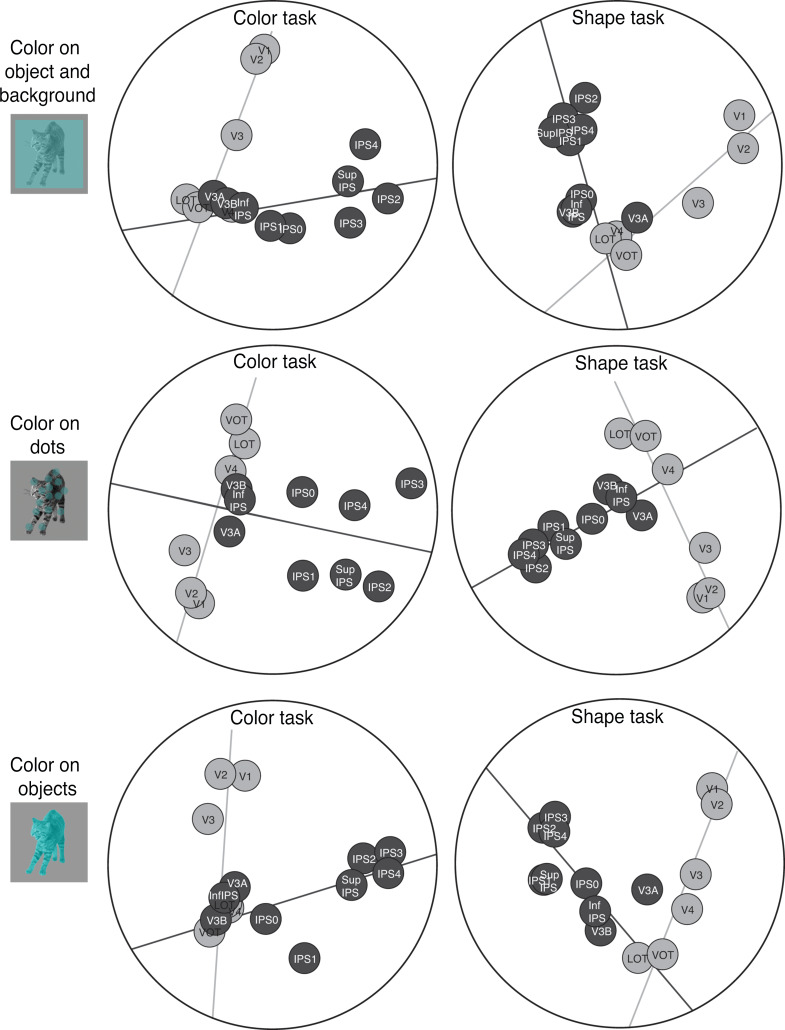
Figure 7.
Results of the MDS analysis on the region-wise similarity matrices for the shape (left panels) and color (right panels) tasks in Experiments 5–7. The top, middle and bottom rows show the 3 color and shape manipulations, respectively, with color appearing on the object and background, on dots overlaying the objects, and on the objects. The 2-pathway structure (i.e., the light and dark gray total least square regression lines through the OTC and PPC regions, respectively) accounted for 63% and 58%, respectively, of the amount of variance in the region-wise differences in visual object representation in the shape and color tasks in Experiment 5. These values were 65% and 63% in Experiment 6, and 61% and 63% in Experiment 7. No systematic difference was observed across these 3 experiments and the 2 tasks. The 2-pathway structure thus remains stable across variations in the 2 tasks used here.

