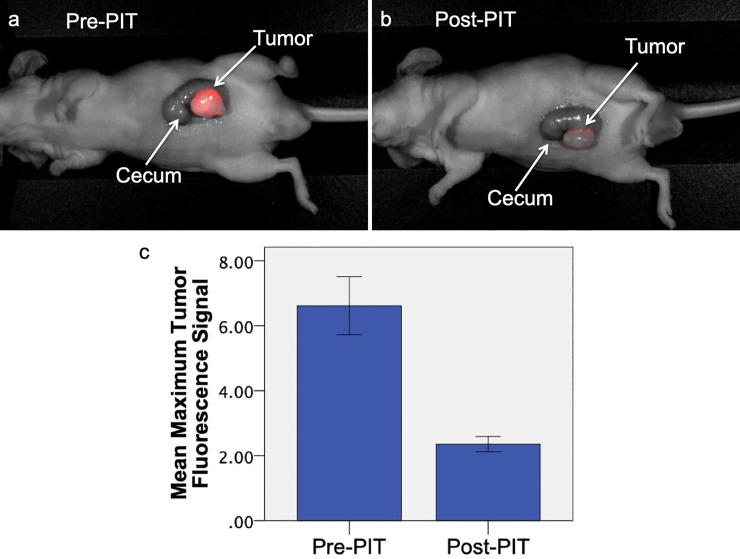
Fig 3. Comparison of pre-treatment and post-treatment fluorescence imaging in orthotopic LS174T mouse models.
The mouse received 25 μg m5A-700 24 hours before treatment. Prior to PIT treatment (a), tumor margins had a distinct NIR fluorescence signal (maximum tumor fluorescence 4.54). After PIT treatment (b), maximum fluorescence signal decreased to 2.82. (c) Mean maximum fluorescence tumor signal before and after PIT (n = 12). There is a significant difference between mean tumor fluorescence signal before and after treatment with PIT (p < 0.001). Error bars represent standard error of the mean.

