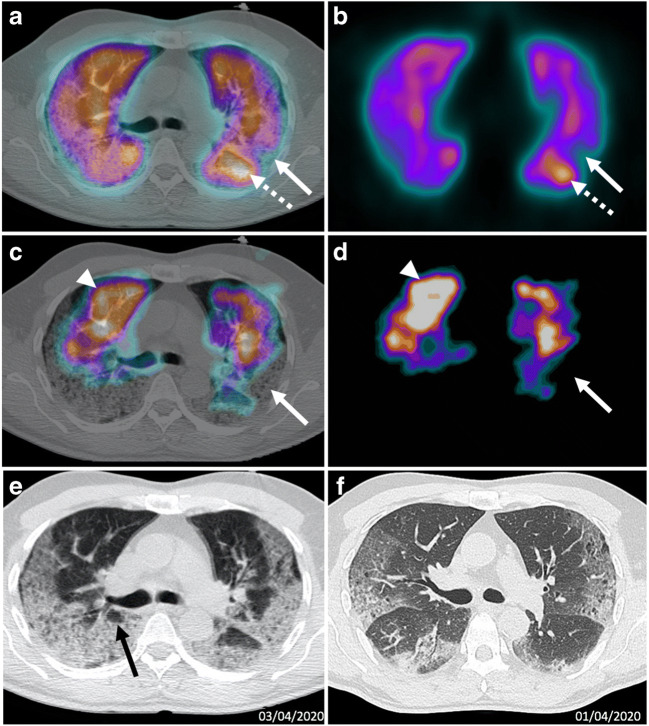
Fig. 3.
a Axial fused perfusion SPECT and CT (185 MBq of Pulmocis®). b Axial Perfusion SPECT. c Axial fused ventilation SPECT and CT (148 MBq of Krypton®). d Axial Ventilation SPECT. e Axial CT scan V/Q SPECT/CT April 3. f Axial CT scan April 1. Matched defects (white arrows), dominated by ventilatory anomalies, are located in areas of parenchymal consolidation on the CT scan. There is an accumulation of the perfusion tracer (white dotted arrow) and also of the ventilation tracer (white arrow head) in adjacent healthy parenchyma areas. CT scan shows an increase of the extent of the COVID-19 lesions, now critical (> 75% of the total volume). Note the cystic areas (black arrow)

