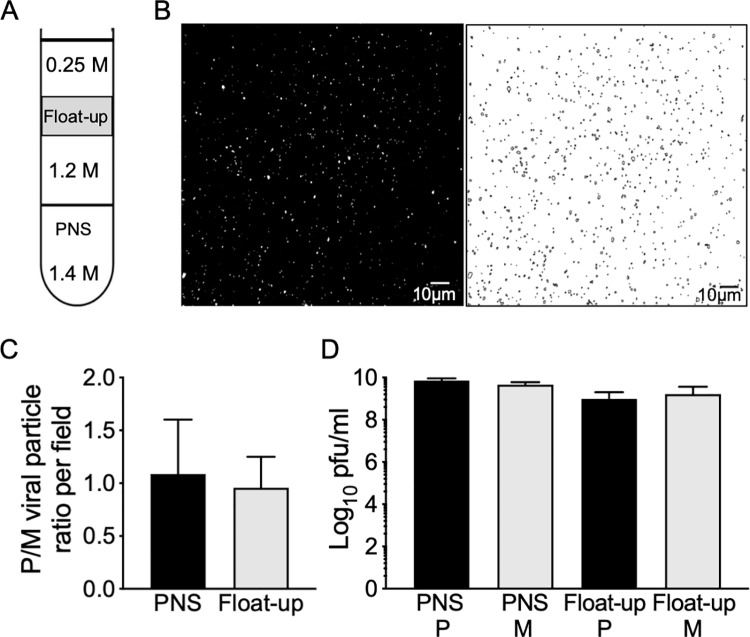
Fig 1. Quantitation of particles and infectious virions produced by Δ(gE/gI-US9p) and parental PRV in PK15 cells.
PK15 cells were infected by parental (P) and Δ(gE/gI-US9p) mutant (M) PRV. A PNS was then prepared, adjusted to a final sucrose concentration of 1.4M, overlaid with 1.2M and 0.25M sucrose layers then subjected to density gradient flotation to isolate buoyant cytoplasmic particles. (A) Gradient conditions showing molarity of sucrose in each cushion and location of the buoyant float-up fraction (grey rectangle). (B) Left half of panel shows microscopic field of a sample of the float-up fraction viewed in the red channel to image particles labeled with the mCherry-tagged UL25p capsid subunit. Right half of panel shows Fiji-processed image used for quantitation. (C) Relative numbers of mCherry-fluorescent P and M particles in microscopic fields of PNS (black bar) or float-up (grey bar) samples. Y axis corresponds to the ratio of numbers of P and M PRV particles counted in microscopic fields imaged and analyzed as in panel B. Plotted ratios are the mean and standard deviation from the mean for three independently prepared sets of P and M extracts, each of which was quantitated using at least seven independently prepared microscopic fields. Total particle numbers counted were 285,226 (P) and 185,576 (M) (PNS) and 10,069 (P) and 11,652 (M) (float-up). (D) Samples of PNS and float-up from P (black bars) and M (grey bars) infected cells were sonicated and titrated onto preformed Vero cell monolayers. Plotted values are the mean and standard deviation from the mean for titers of PNS and float-up samples prepared from three independently derived sets of P and M cell extracts, each titered in duplicate.

