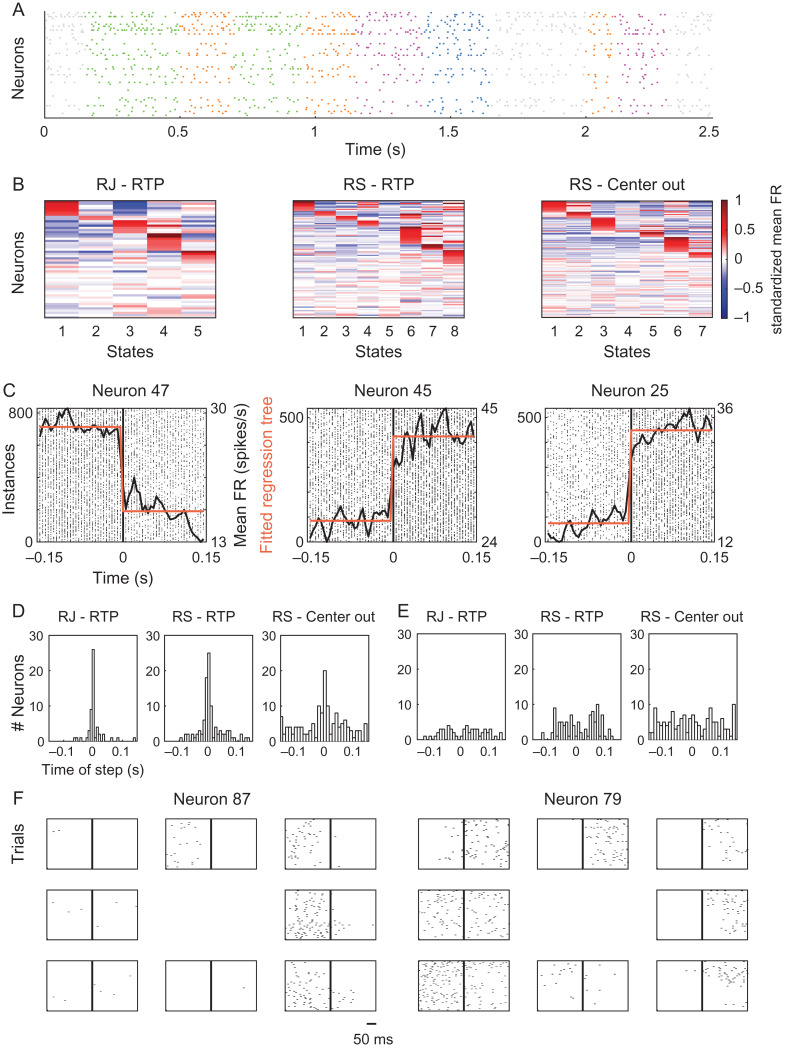
Figure 6.
Modulation in the activity of single cells across neural states. (A) Example spike trains of single neurons during a single RTP trial, colored according to the decoded neural states. Data from RJ. (B) Standardized mean firing rates of single cells within each state. Red colors denote positive values, indicating neurons that were active above their mean, blue colors denote negative values, indicating neurons that were active below their mean. To aid in visualizing the active neurons in each state we sorted the cells (i.e., the rows of each matrix) by their activity in a sequential manner. We first placed cells that showed standardized values above 0.25 in the first state, then, from the remaining cells, cells that crossed the same threshold in the second state, and so on until the last state (red “block” within each state). Cells that did not cross this threshold in any of the states were placed last with no particular order. (C) Spike trains of 3 single cells aligned to the time point of transition between a specific pair of neural states (time zero, black vertical line), showing an abrupt change in firing rate. Plotted on top are the mean firing rate across the different instances (black line) and the fitted regression tree (step-like function in orange). Data from RJ. (D) Histograms of the time of the step of the best fitted regression tree for each neuron, for all 3 datasets, showing a peak around time zero – corresponding to the time of a state transition. (E) Similar to D, but here the regression trees were fitted to the mean firing rate calculated on firing patterns that were aligned to the middle point of the state, showing no evident peak at any time point. See also Supplementary Figure 5. (F) Spike trains of two example neurons recorded during the center-out trials, aligned to peak speed minus 100 ms lag (vertical line in the middle of each panel). The panels are organized according to the direction of motion of each condition. The neuron displayed on the left showed an increase in activity only during the acceleration phase, coupled with directional selectivity. The neuron displayed on the right showed an increase in activity during acceleration and deceleration, depending on the direction of movement.

