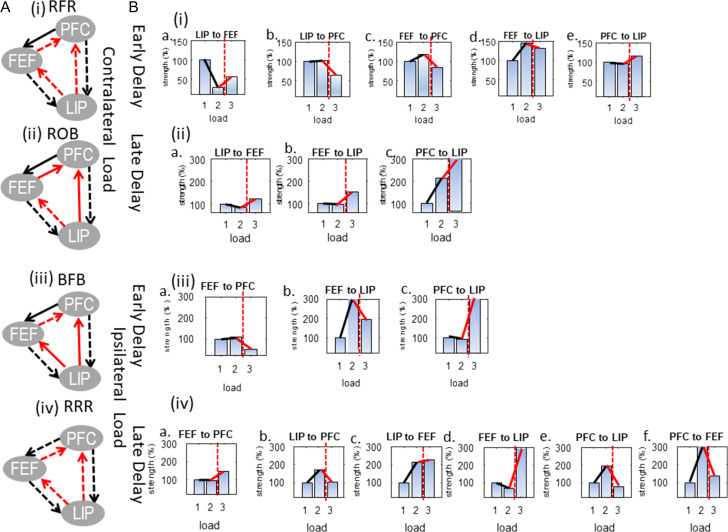
Figure 7.
(A) Models that had the highest evidence for each experimental condition. Dashed lines denote connections that were modulated by load. RFR and ROB were the winning models for contralateral load during (i) early and (ii) late delay and BFB and RRR were the winning models for ipsilateral load during (iii) early and (iv) late delay. (B) Changes in neuronal coupling strengths due to changes in (i) contralateral load during early delay; (ii) contralateral load during late delay; (iii) ipsilateral load during early delay; and (iv) ipsilateral load during late delay. Coupling strengths corresponding to the lowest load are shown with blue bars. The cognitive capacity limit is shown with a vertical red dashed line. Strength changes below (respectively above) the capacity limit are shown with black (respectively red) lines.

