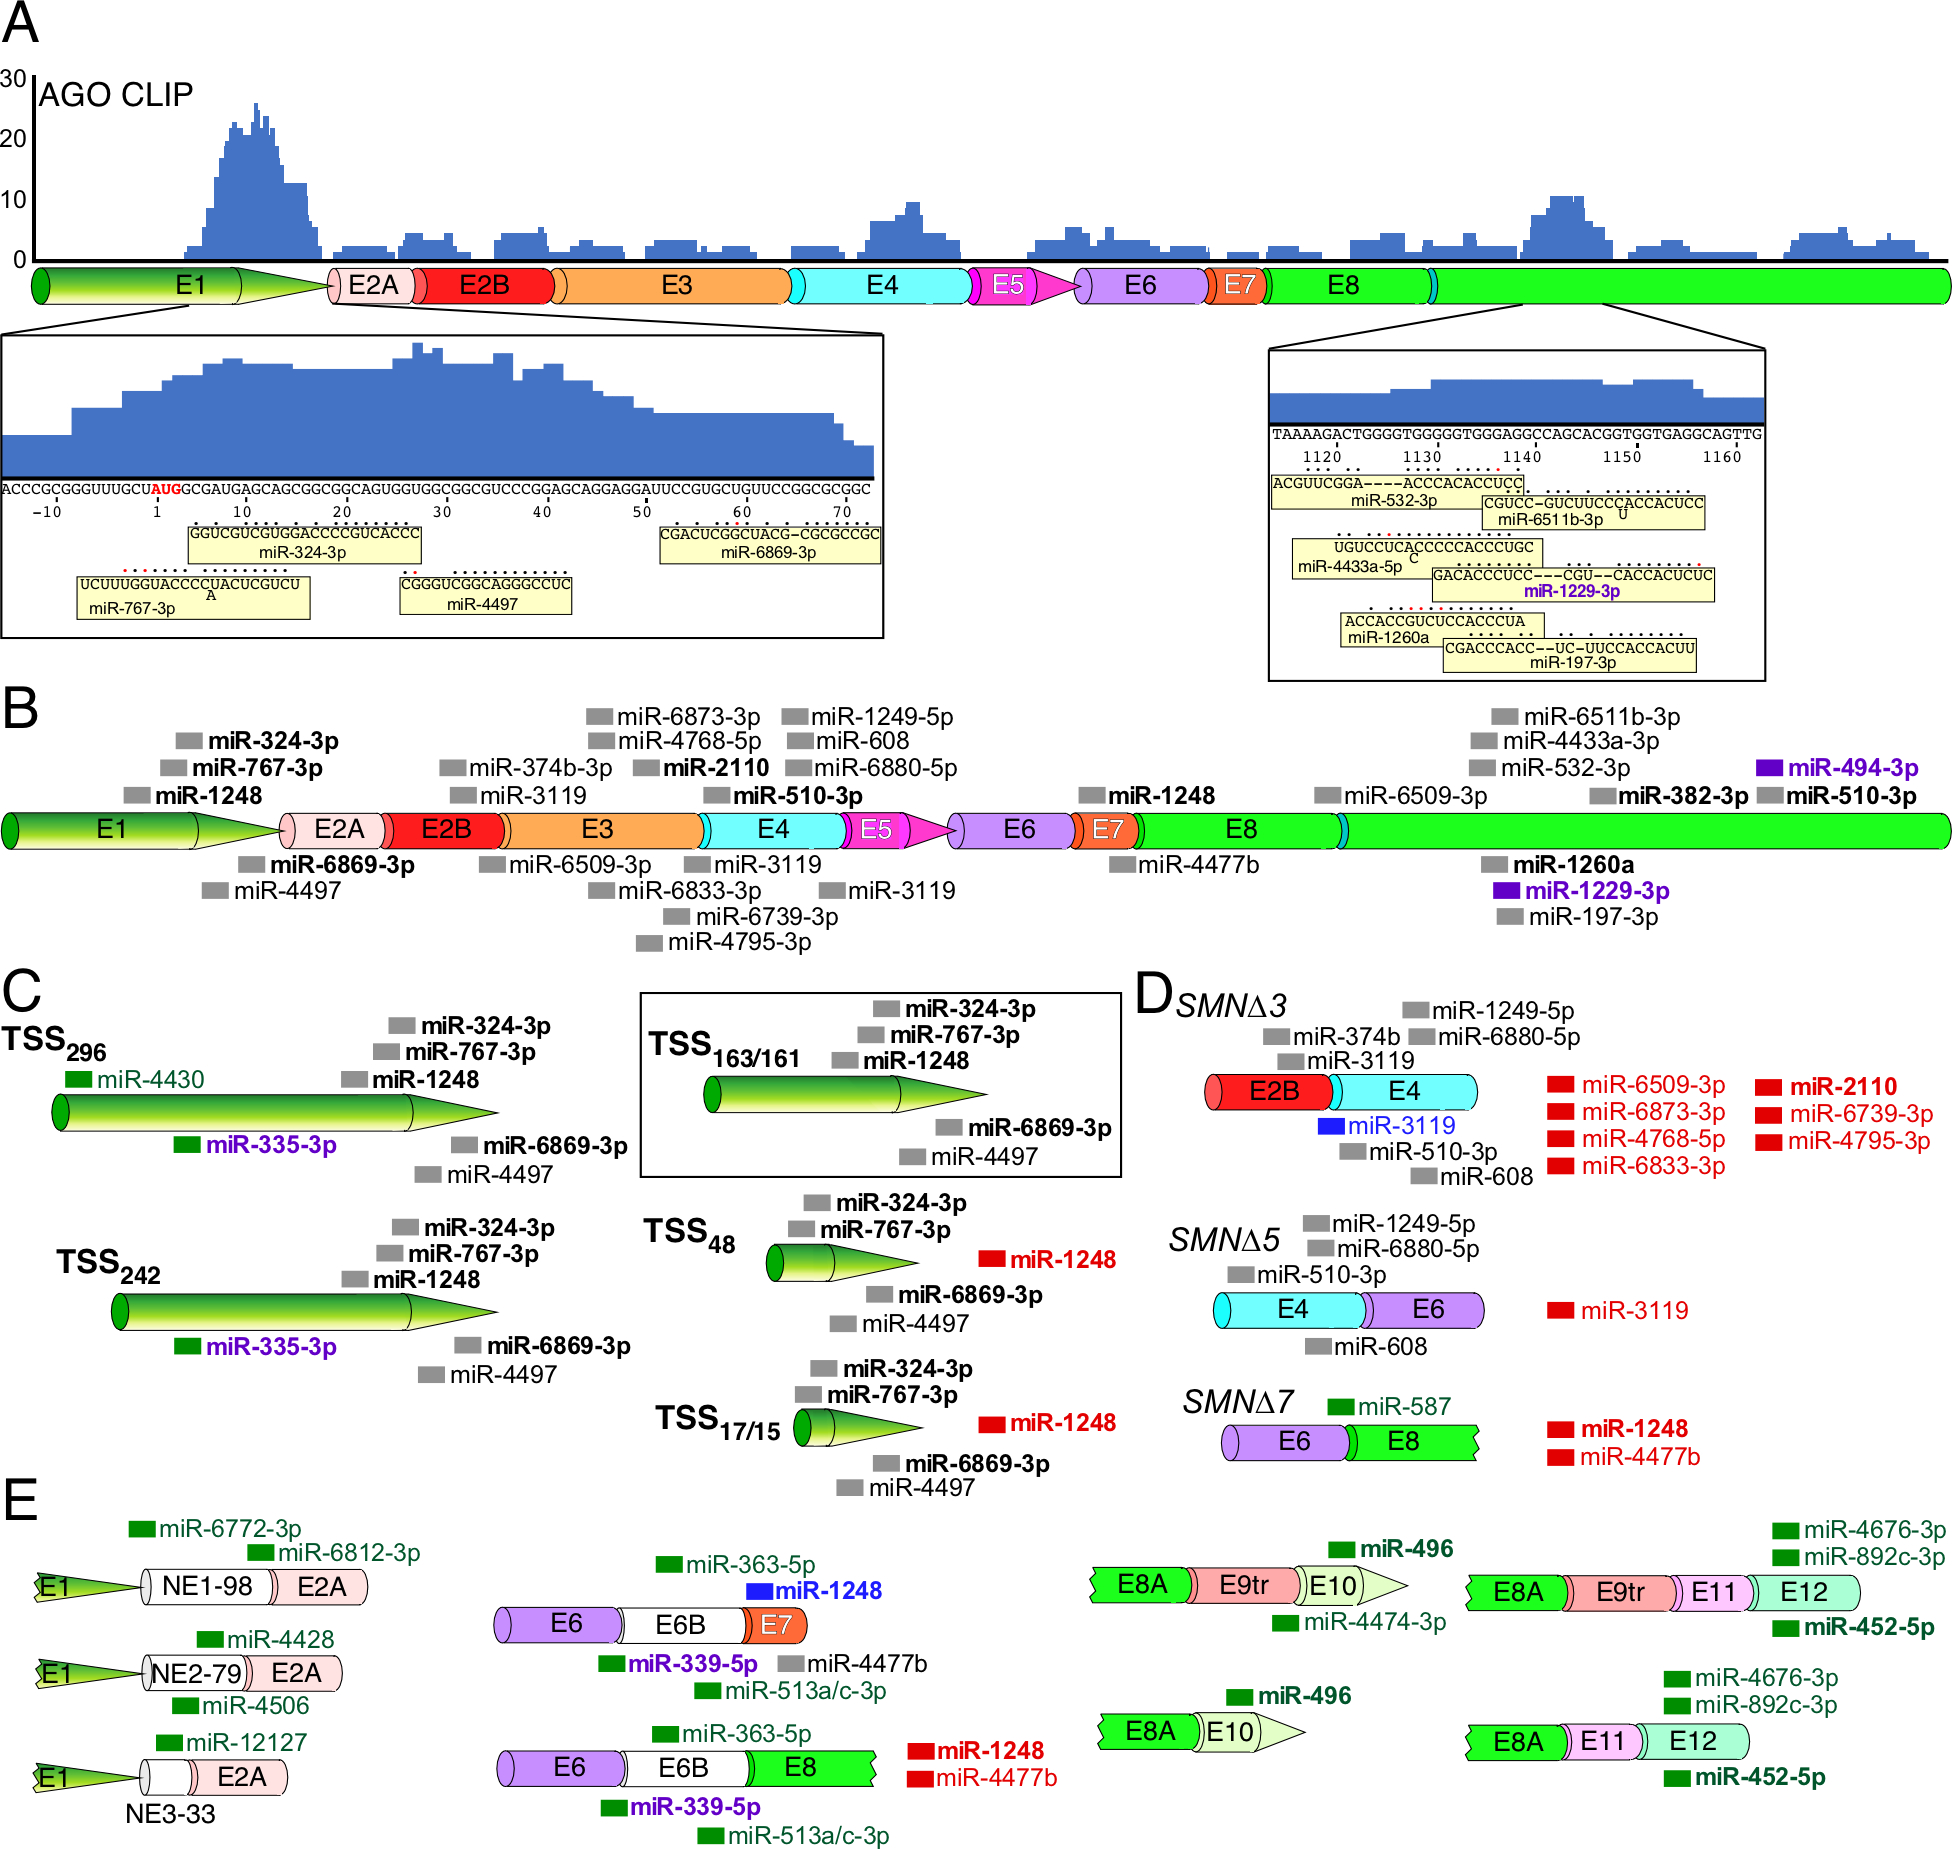
Figure 5. Predicted miRNA binding sites across SMN transcripts.

(A) AGO CLIP performed using HeLa cells reveals potential miRNA targets throughout the length of SMN mRNAs. Height of blue bars represents the number of overlapping reads at each position. Corresponding exons are shown diagrammatically below CLIP signal. Exon labeling and coloring are the same as in Fig. 3B. SMN sequences corresponding to two prominent peaks as well as miRNAs that target them are given at the bottom of panel A. The AUG start codon is shown in red letters. Nucleotide numbering is the same as in Fig. 2D. miRNAs are shown as yellow boxes. Their base pairing with the corresponding SMN targets is indicated with black circles; red circles mark wobble base pairing. Dashes indicate where base pairing between a miRNA and its SMN target is not continuous. “Out of line” letters in miRNA sequences indicate bulged nucleotides (miR-767–3p, miR-6511b-3p and miR-4433a-5p). (B) The canonical SMN mRNA transcript is shown. Exon labeling and coloring are the same as in Fig. 3B. miRNA target sites are marked with thick colored lines and miRNA names are given to the right of each site. miRNAs with names shown in bold correspond to miRNAs with known targets and/or functions. Purple color indicates that a miRNA is implicated in neurodegeneration. (C) Alternative TSS usage affects miRNA targeting profile. The name of each TSS is given at the left. The canonical transcript derived from Refseq annotation is boxed in black. miRNAs target sites unique to alternative (non-canonical) transcripts are labeled in green. miRNAs whose binding sites are lost in alternative transcripts are shown to the right side of the transcript and labeled in red. miRNAs with green lines and purple names indicate miRNAs unique to alternative transcripts that are also implicated in neurodegeneration. (D) Alternative splicing affects miRNA targeting profile. miRNAs shown in blue are predicted to have altered but preserved targets between two alternatively spliced junctions. Other labeling and coloring is the same as in (C) (E) Inclusion of rare exons results in novel miRNA target sites. Labeling and coloring is the same as in (C) and (D).
