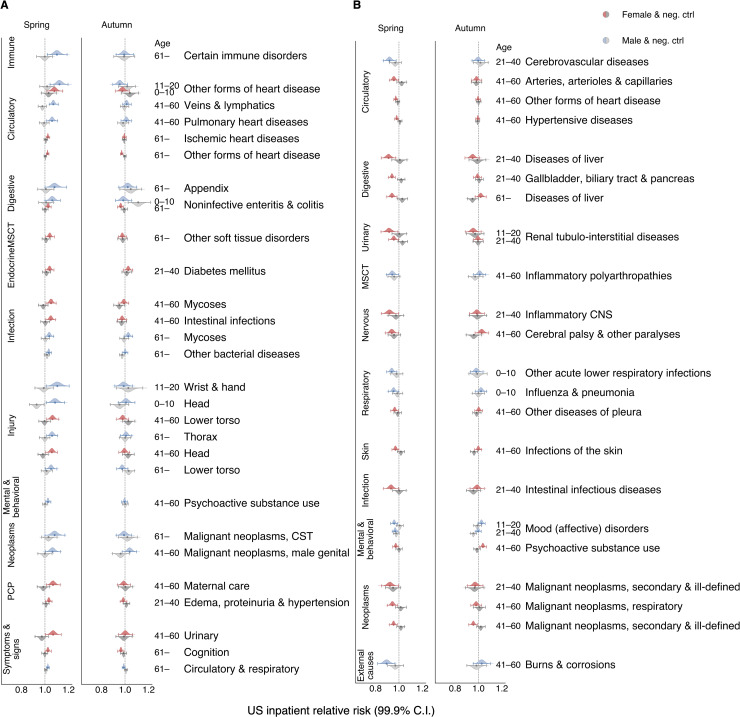
Fig 1. Daylight saving time (DST) shifts appear to affect the relative risk (RR) of numerous diseases spanning several human biological systems.
Color-coded violin plots and error bars represent RR estimates’ posterior density distributions and credible interval (CI) boundaries, respectively. We adjusted the credible intervals (CI) for multiple tests with a Bayesian shrinkage procedure that ensured 99.9 and 99 percent significance levels for US and Swedish data, respectively. Gray-colored violin plots and error bars indicate analogous RR distribution results computed for the negative control (pseudo-DST shift dates, the same populations as for the real DST shift dates). The pseudo-DST shift date was selected at 28 days after the real DST shift in spring and 28 days before the real one in autumn. For the Swedish tests, negative controls were performed on data before 1980 when DST was not observed in Sweden. We selected all depicted signals automatically (see S1 Appendix Section 2.1), as the significant RR largest in effect size that were: (1) significantly greater than one in the spring DST shift analyses (colored), and: (2) not significantly greater than one in the negative control (gray) analyses, or vice versa for decreased signals. We also excluded too broadly defined, ambiguous clinical and laboratory findings, examinations, and health services from the figures (they are retained in the Supplementary Tables). (A) The top 30 conditions exhibiting the largest increasing RRs (effect sizes) for the results of the US inpatient analyses. The results suggest risk expansion in diseases involving the immune, circulatory, and digestive systems, the musculoskeletal system and connective tissue (MSCT), the endocrine systems, some infections and injuries, mental and behavioral disorders, neoplasms, problems with pregnancy, childbirth, and the puerperium (PCP), and symptoms and signs across various systems. (B) All disease conditions with significantly decreased RR in inpatient data after the spring DST shift (minus ambiguous procedures).

