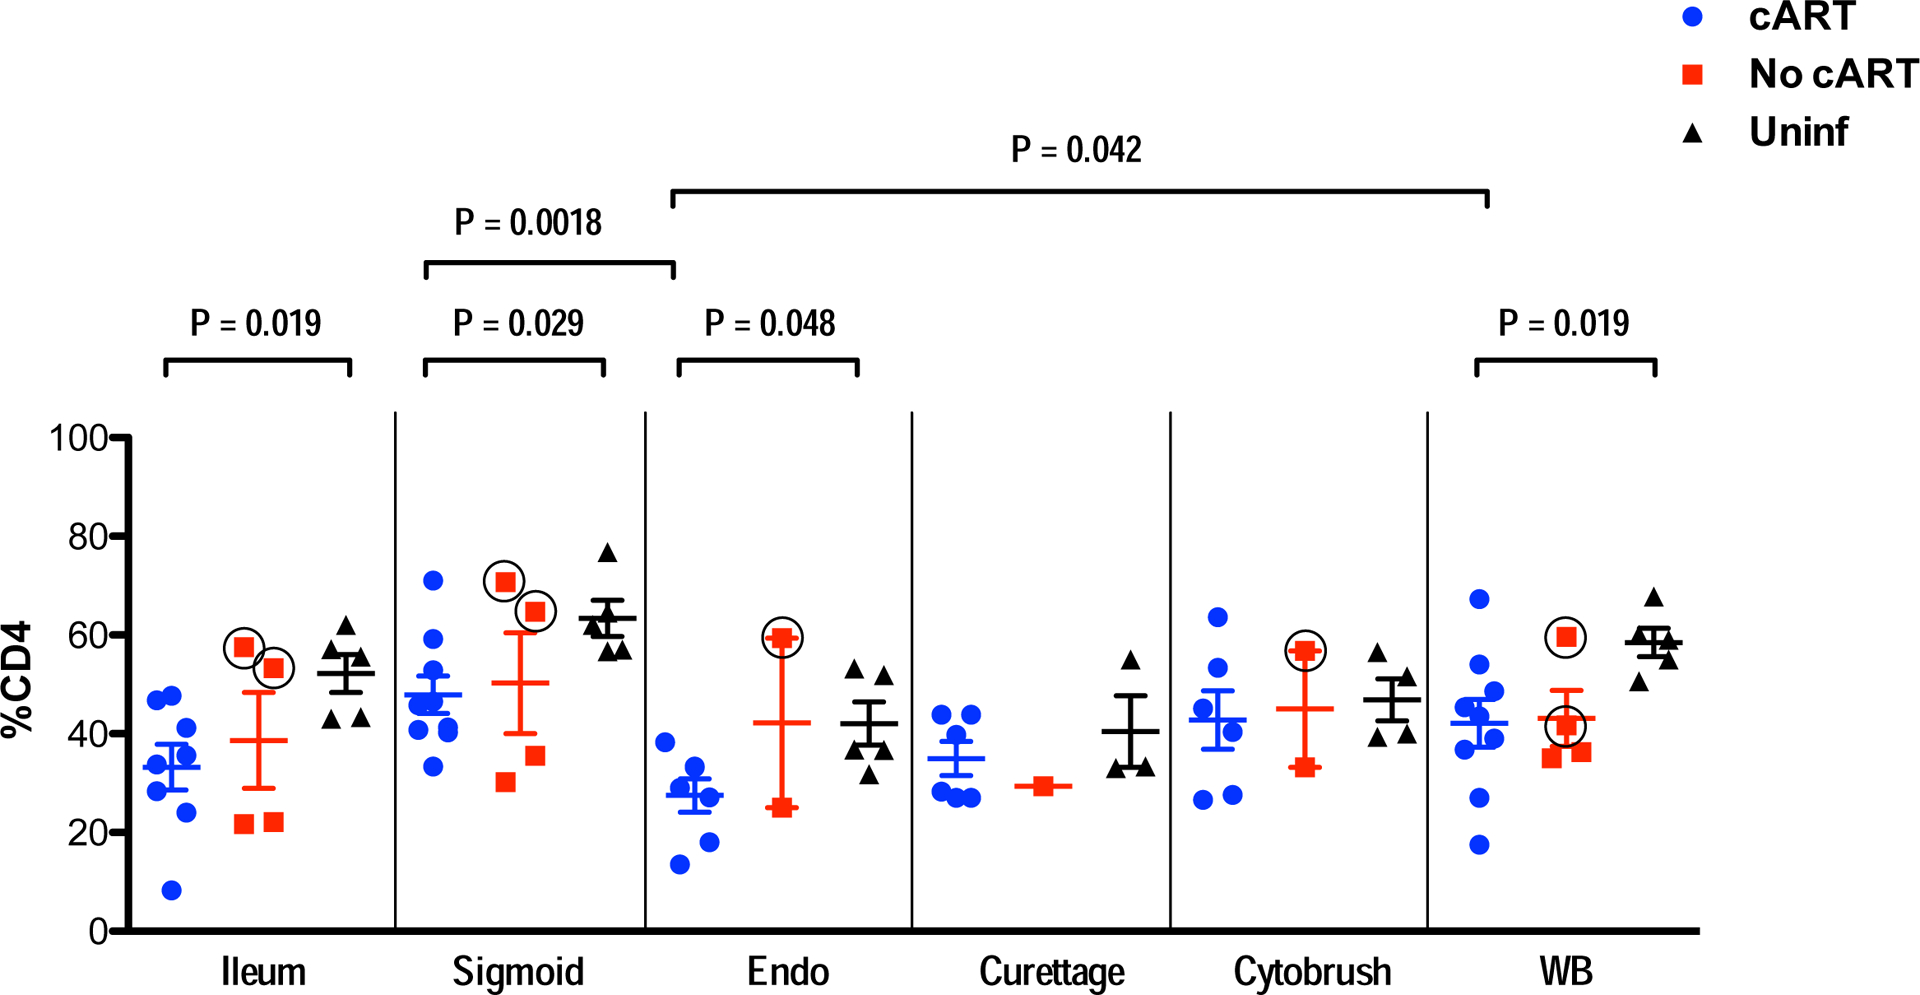
Figure 1. Percentages of CD4+ T-cells in GIT, FRT and WB.

CD4+ T-cell percentage, relative to all viable CD3+ cells, is indicated on the y-axis. Tissue types are indicated on the x-axis. After initial gating based on scatter characteristics and doublet discrimination, viable cells (based on Aqua dye exclusion) were gated for expression of CD3, followed by CD49. As described in the text, the No cART group included two HIV controllers; data points for these two participants are identified as red squares with black circles. Abbreviations: Endo, endometrium; Uninf, uninfected; WB, whole blood. Comparisons between groups and tissues were performed with Mann-Whitney and Wilcoxon matched pairs signed rank tests, respectively. Horizontal and vertical bars represent mean and standard deviation, respectively. Significant differences, either between participant groups within a single tissue type or between tissues within a participant group, are indicated by horizontal brackets.
