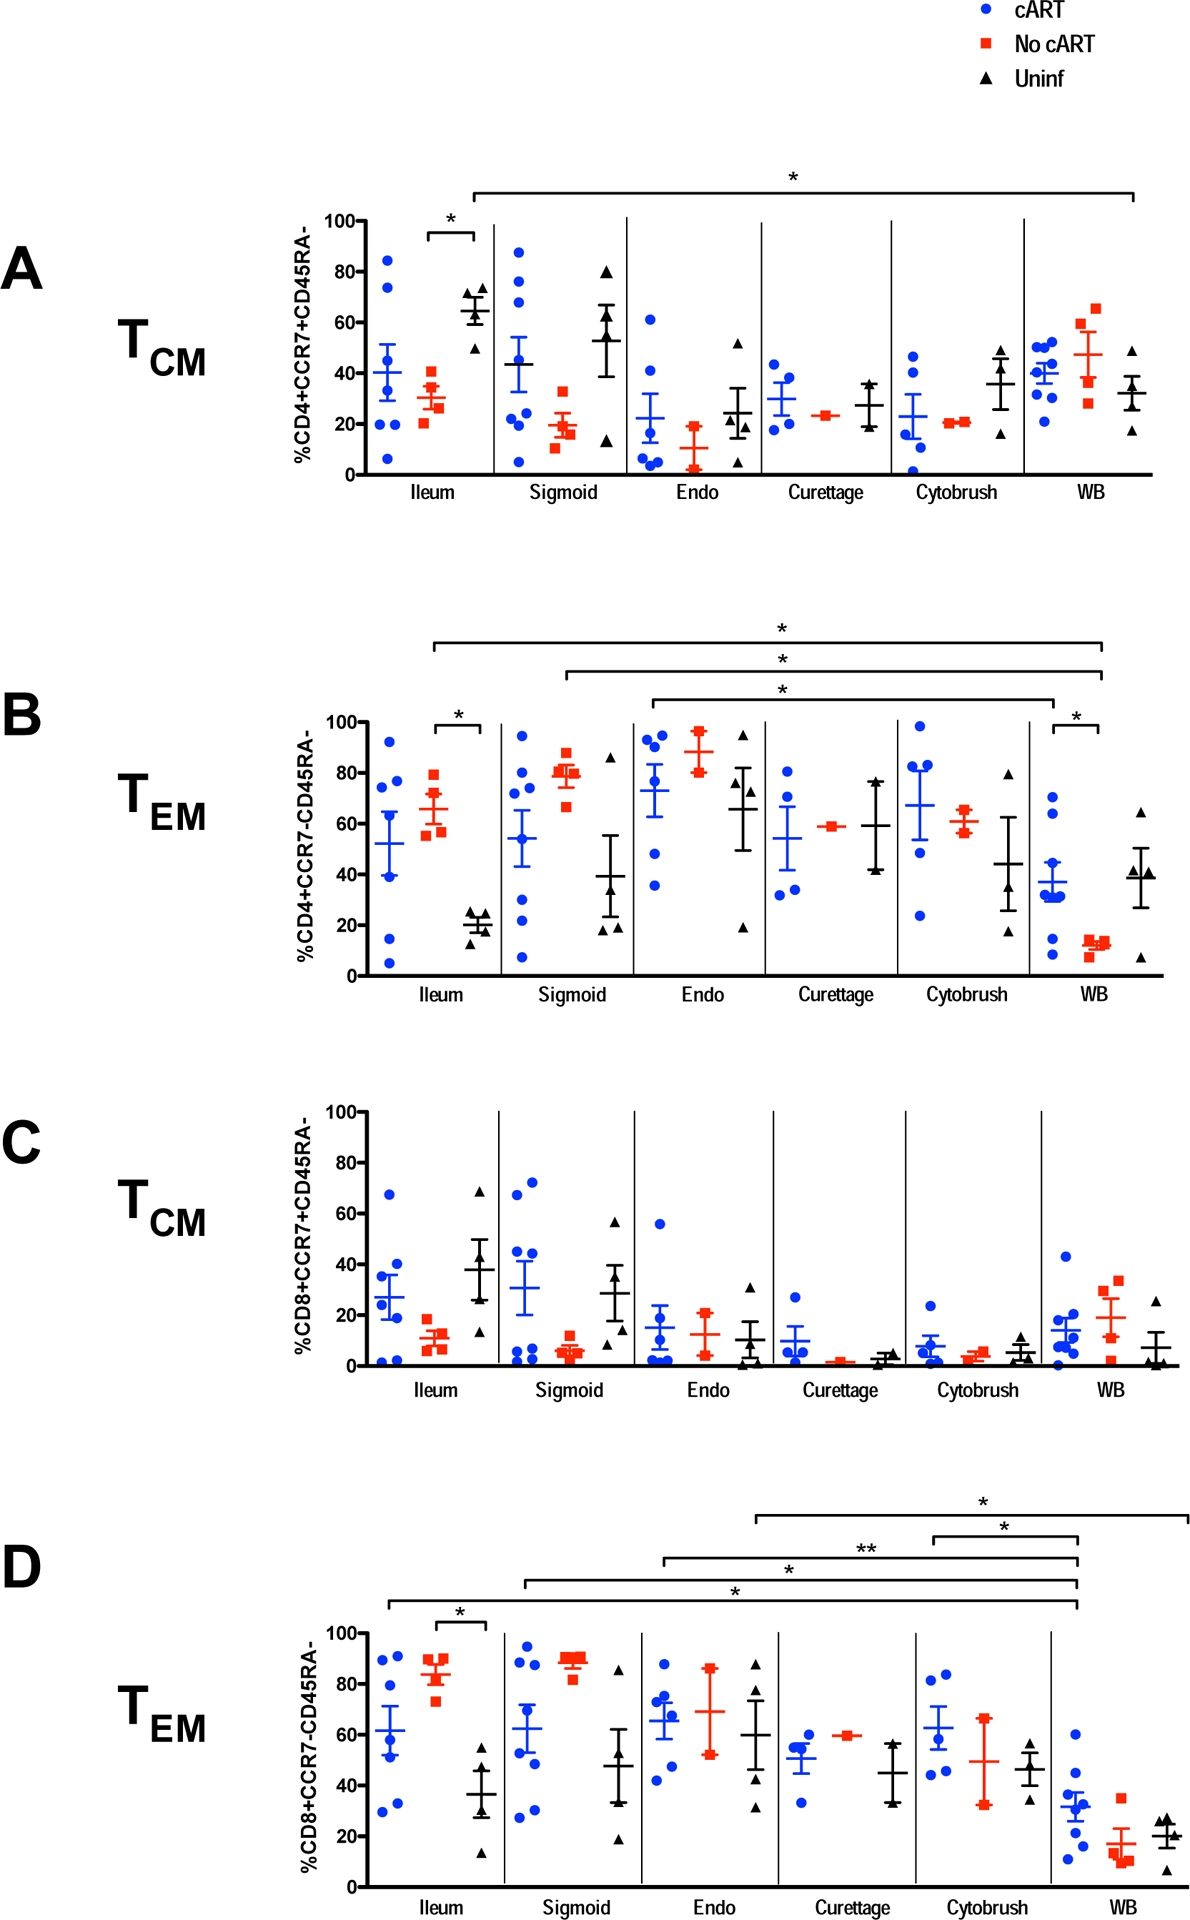
Figure 3. Memory T-cell subsets.

Percentages of central (A, C) and effector memory (B, D) T-cells. Panels A and B correspond to CD4+ T-cells; C and D are CD8+ T-cells. After initial gating based on scatter characteristics and doublet discrimination, viable cells (based on Aqua dye exclusion) were gated for expression of CD3, followed by CD4 and/or CD8, and finally CD45RA and/or CCR79. Abbreviations: Endo, endometrium; Uninf, uninfected; WB, whole blood. Comparisons between groups and tissues were performed with Mann-Whitney and Wilcoxon matched pairs signed rank test, respectively. The horizontal and vertical bars represent mean and standard deviation, respectively. Significant differences, either between participant groups within a single tissue type or between tissues within a participant group, are indicated by horizontal brackets with asterisks to indicate P values as follows: *P < 0.05; **P < 0.01.
